State of Node.js Performance 2024
The year is 2024, and Node.js has reached version 23. With two semver-majors released per year, it might be difficult to keep track of all aspects of Node.js. This article revisits the State of Node.js performance, with a focus on comparing versions 20 through 22. The goal is to provide a detailed analysis of how the platform has evolved over the past year.
This is a second version of “The State of Node.js Performance” series. If you haven’t read the 2023 version, I recommend doing so.
This year’s report continues the tradition of rigorous benchmarking, providing hardware details and reproducible examples. To streamline the experience, reproducible steps are collapsed at the start of each section, making it easy for readers to follow along without distraction.
This article exclusively compares Node.js versions without drawing parallels to other JavaScript runtimes. The intent is to highlight the platform’s internal progress—its performance gains, regressions, and the factors driving these changes.
Benchmark Setup
This blog post will share benchmark results across different Node release lines.js using two repositories as references:
- Node.js Internal Benchmark Suite
-
nodejs-bench-operations
- Using bench-node as the benchmark tool
Benchmarks were run on a dedicated AWS machine (C6i.xlarge) with:
- 4 vCPUs, 8GB RAM
- Ubuntu 22.04 LTS
The following Node.js versions were used:
- v20.17.0
- v22.9.0
Several key modules significantly impact Node.js performance. Any enhancements or regressions within these core components resonate across the platform. For this benchmark, I selected the following core modules:
-
assert- Node.js assert operations -
buffers- Node.js Buffer operations -
diagnostics_channel- Node.js diagnostics channel module -
fs- Node.js file system -
path- Node.js path module on UNIX systems -
streams- Node.js streams creation, destroy, readable and more -
misc- Node.js startup time usingchild_processesandworker_threads+trace_events -
test_runner- Node.js test runner -
url- Node.js URL parser -
util- Node.js text encoder/decoder -
webstreams- Node.js WebStreams (per WHATWG spec) -
zlib- Node.js zlib API
All benchmark results are available at RafaelGSS/state-of-nodejs-performance-2024 as well as the benchmark script executed in the dedicated machine.
How Node.js Benchmarks Are Evaluated
As mentioned in “State of the Node.js Performance 2023”, the Node.js benchmark suite by default runs each configuration 30 times to ensure accuracy, and the results undergo a statistical analysis using the Student’s t-test, which measures the confidence level of each benchmark.
Three asterisks (***) indicate high confidence in the data as we can see below:
                                                                              confidence improvement accuracy (*)   (**)  (***)
fs/readfile.js concurrent=1 len=16777216 encoding='ascii' duration=5                 ***     67.59 %       ±3.80% ±5.12% ±6.79%
fs/readfile.js concurrent=1 len=16777216 encoding='utf-8' duration=5                 ***     11.97 %       ±1.09% ±1.46% ±1.93%
fs/writefile-promises.js concurrent=1 size=1024 encodingType='utf' duration=5                 0.36 %       ±0.56% ±0.75% ±0.97%

Be aware that when doing many comparisons the risk of a false-positive result increases.
In this case, there are 10 comparisons, you can thus expect the following amount of false-positive results:
  0.50 false positives, when considering a   5% risk acceptance (*, **, ***),
  0.10 false positives, when considering a   1% risk acceptance (**, ***),
  0.01 false positives, when considering a 0.1% risk acceptance (***)
Performance Updates and Semantic Versioning
Many performance improvements arrive as semver-minor or semver-patch updates. While Node.js v22.9.0 might currently outperform Node.js v20.17.0, this can shift over time, as minor and patch-level improvements in v20 continue to be backported.
To illustrate, here’s a comparison of commits across Node.js v16, v18, and v20. The latest commits, highlighted in yellow, are unlikely to land in v16, as it’s in maintenance mode.
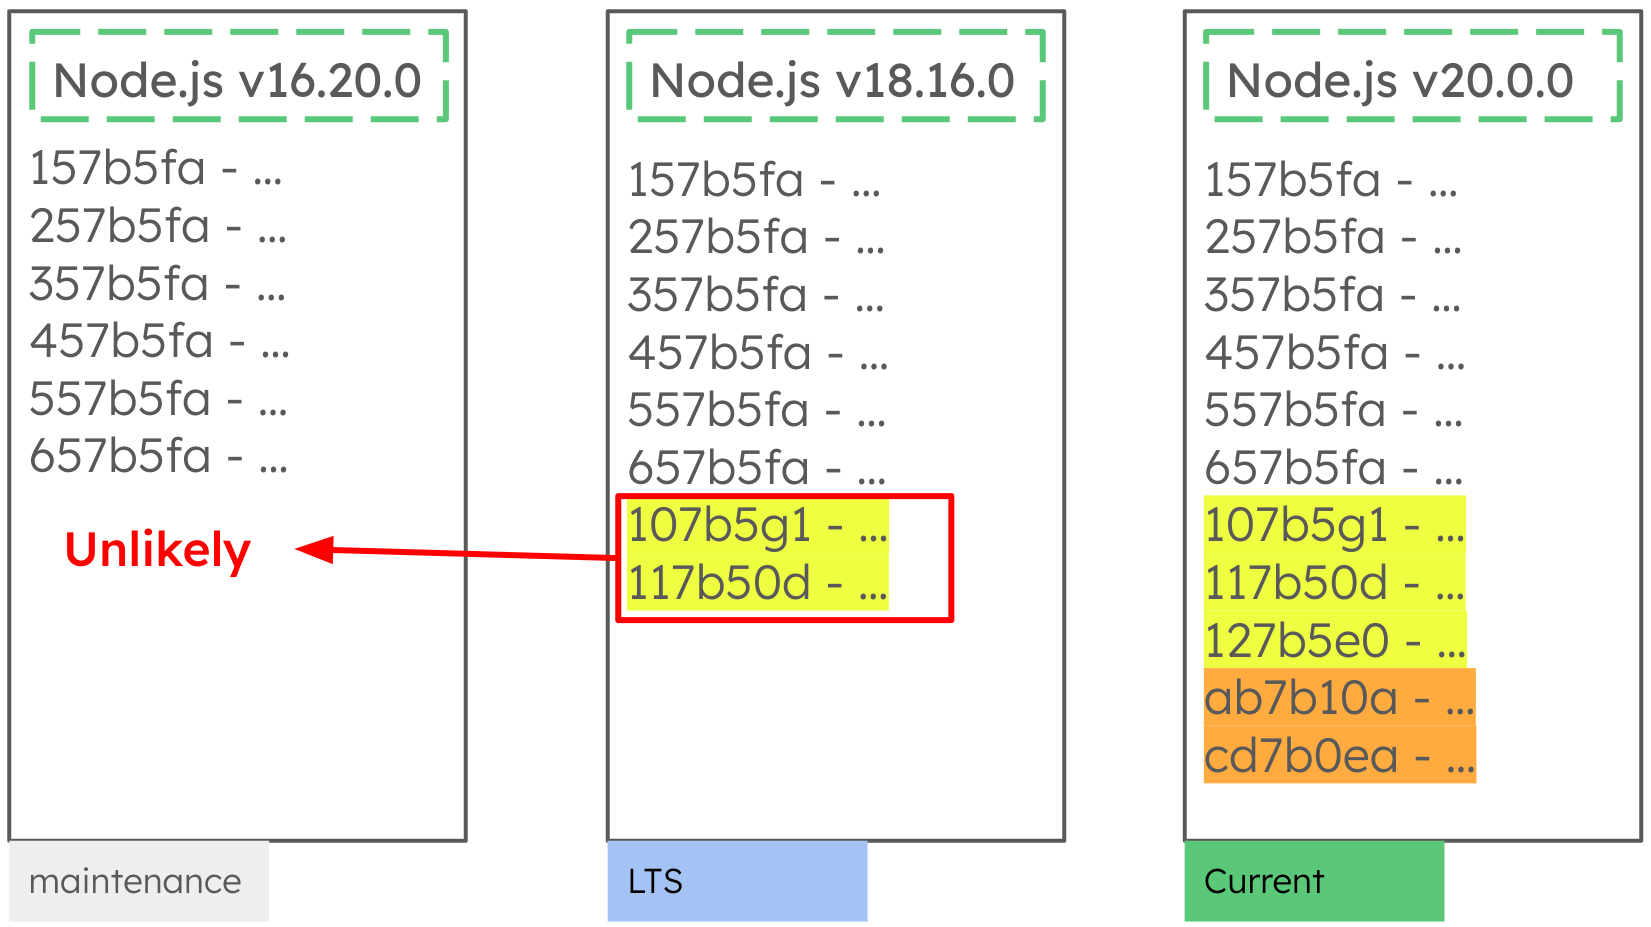
Meanwhile, these latest commits in Node.js v20 have a high chance of being integrated into v18 since it’s in Long Term Support (LTS), meaning these v20 updates can either improve or potentially degrade v18’s performance.
Note: Results across release lines should be viewed with caution, except for release lines that are in End-of-Life (EOL) or Maintenance modes.
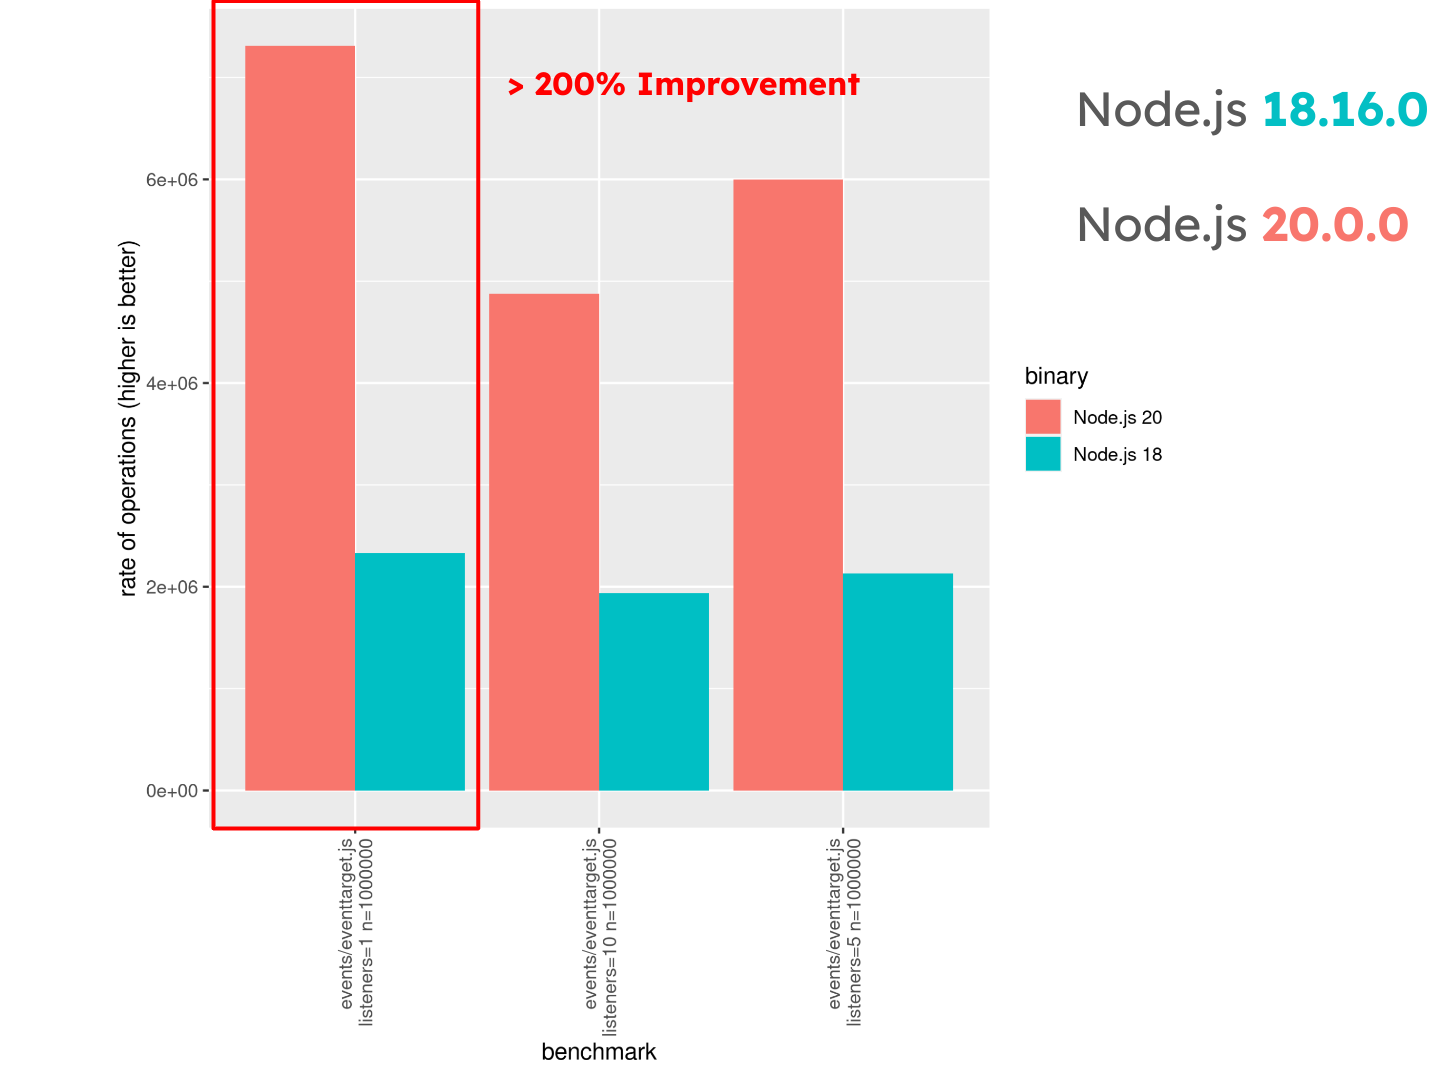
To illustrate this idea in numbers, let’s see a scenario that has been shared in the 2023 report:
Node.js v20.0.0 demonstrated significant gains over v18.16.0 for event handling, specifically with event.target, as shown in the following benchmark. Here, v20.0.0 handles 200% more operations than v18.16.0, showing a major performance increase.
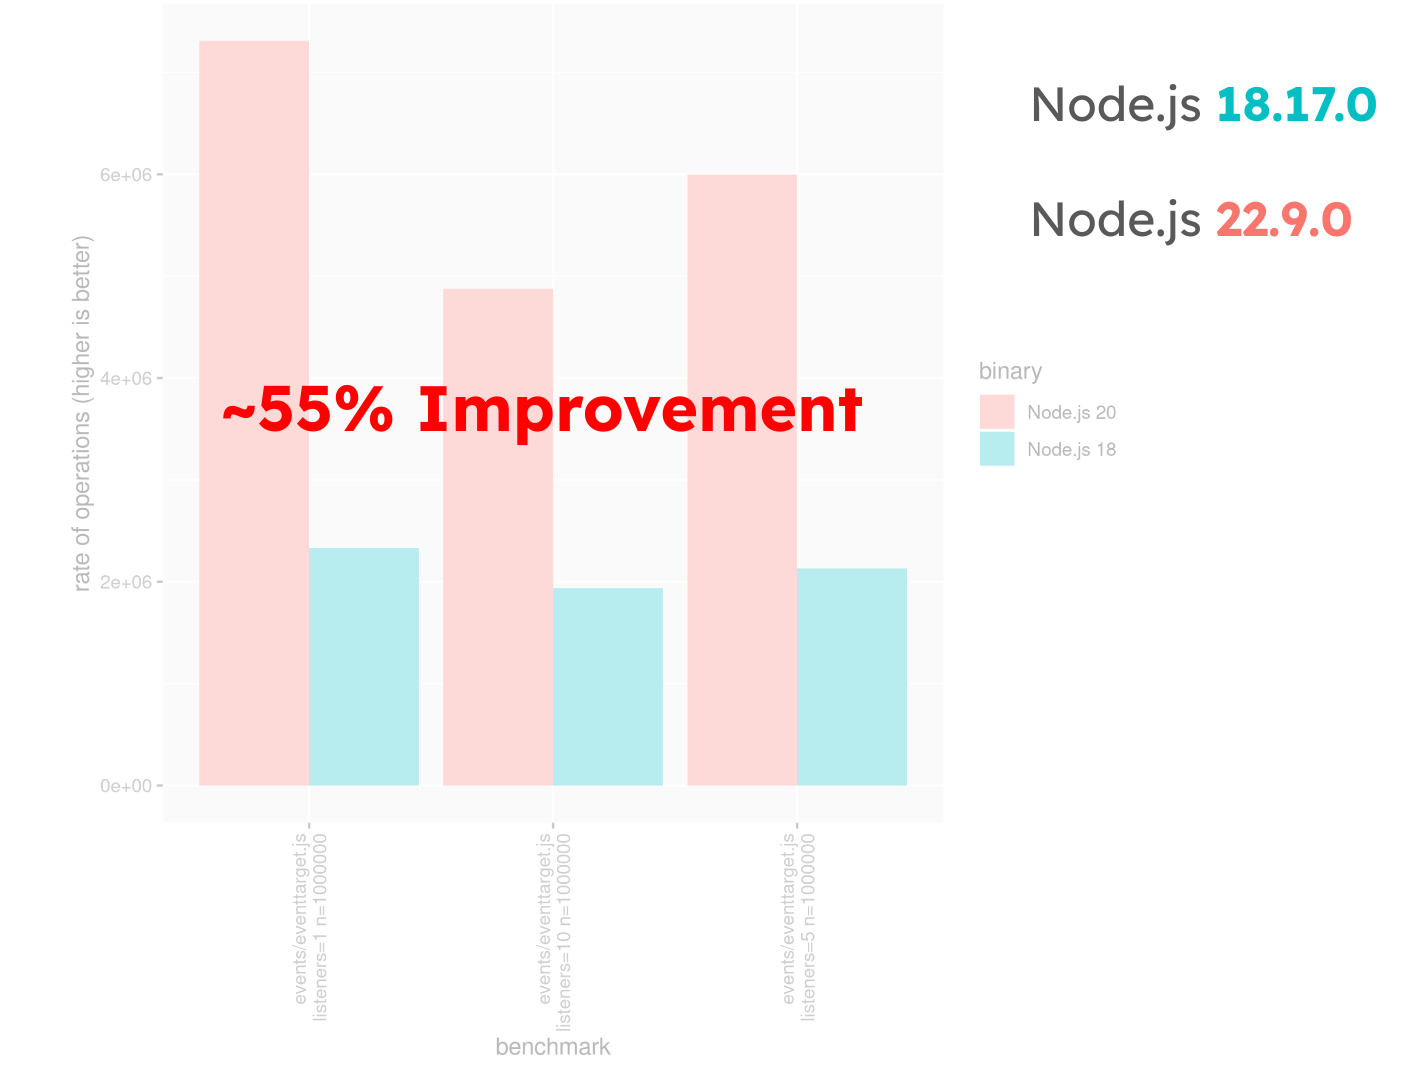
Comparing this with Node.js v22.9.0, the improvement over v18.17.0 is around 55%, not because v22 is slower, but because v18.17.0 received enhancements that closed the performance gap from v18.16.0.
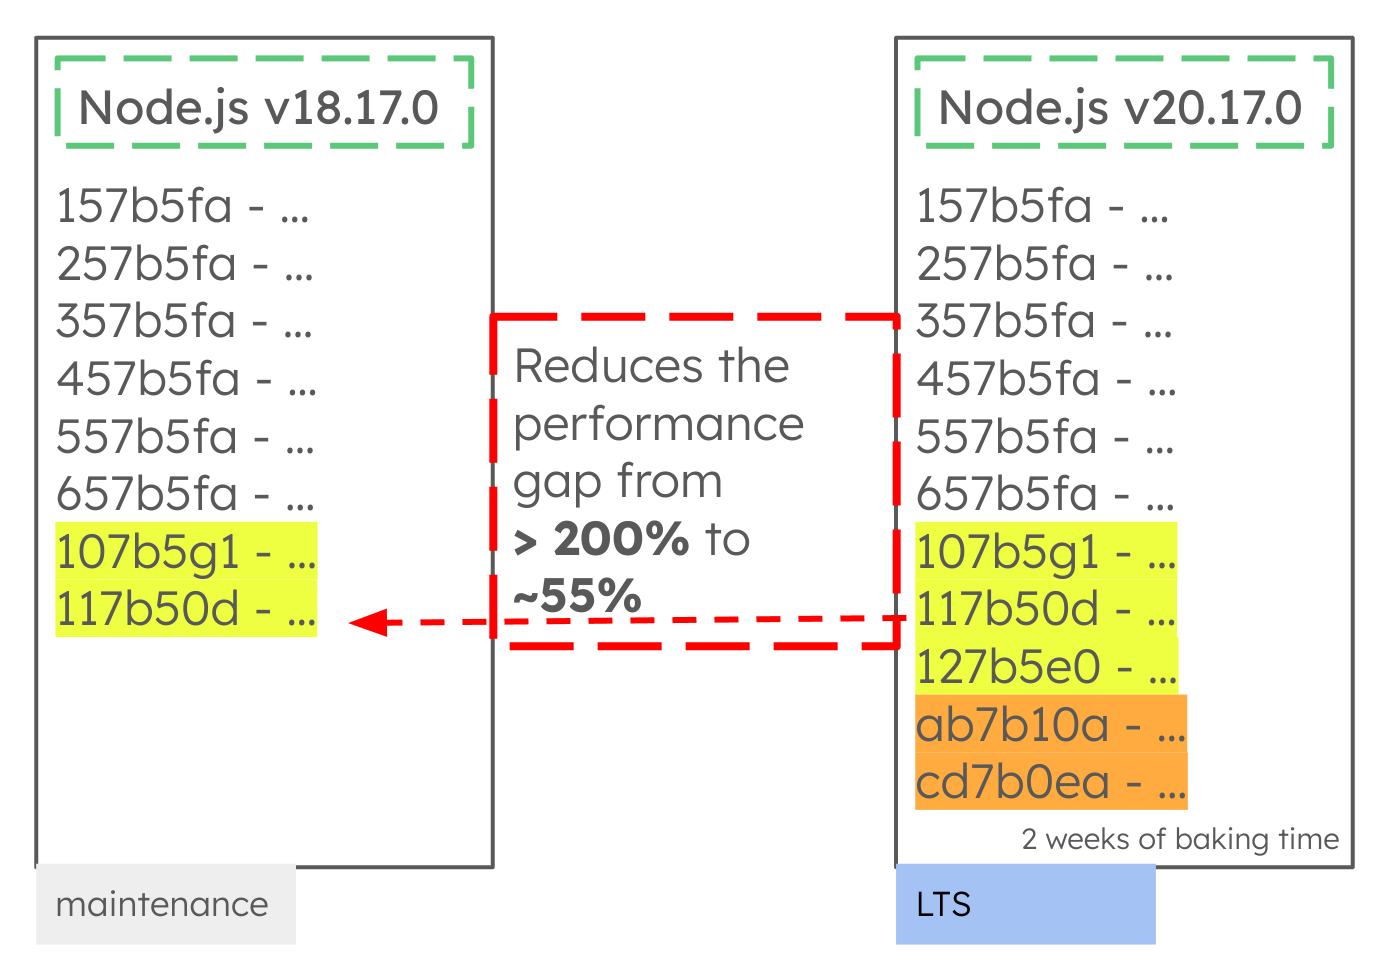
The commits in v20.17.0 (highlighted below) effectively reduce this performance gap from 200% to ~55% in Node.js v18.17.0.
Where to start a benchmarking process?
If you’re new to benchmarking, this blog post is a great place to begin.
-
Prepare the Environment: A golden rule for accurate benchmarking is to control your environment, as almost anything can affect results. For example, running a benchmark during a Zoom call or streaming music can introduce noise into your measurements. In one famous instance from 2004, Brendan Gregg demonstrated that even shouting near the hardware could disrupt slow disk I/O operations!
To avoid such interference, always use a dedicated machine for benchmarking.
-
Isolate the Bottleneck: in order to isolate the bottlenecks, you should reduce the variability as much as you can.
Benchmark workflow:
- Use a dedicated machine to run your benchmarks.
- Run a benchmark before making a change.
- Run the same benchmark after the change.
- Compare the results.
Note: Before Node.js v22.9.0, Maglev, a V8 compiler, was enabled by default in the v22.x release line. This change could lead to a false-positive to regressions if you compare operations per second across different release lines. Node.js v22.9.0 has been released disabling Maglev for different reasons. Therefore, if you conduct a benchmark before Node.js v22.9.0, it may contain inaccuracies due to Maglev’s influence. See: https://github.com/nodejs/performance/issues/166#issuecomment-2103317419
Handle JS Micro Benchmarks with Care
Although many micro-benchmarks are created and spread over the network, micro-benchmarks in JavaScript most of the time (if not all) won’t represent reality and are wrong in rare scenarios. This article won’t expand on why JS Micro-Benchmarks are complex to write and evaluate, but the important take is to read all these values carefully (including the ones shared in this article). Suggestions for reading are:
Node.js Internal Benchmark
This section shares results obtained from running the Node.js internal benchmark suite. Although Node.js contains many modules and thousands of APIs, this article will only share APIs that had a considerable performance impact during the benchmark. Therefore, if your favourite API doesn’t appear on this report, assume that there’s no performance change from v22.9.0 to v20.17.0.
Assert
The node:assert module is widely used with test_runner and other test frameworks so
making it fast will likely make any test suite faster.
-
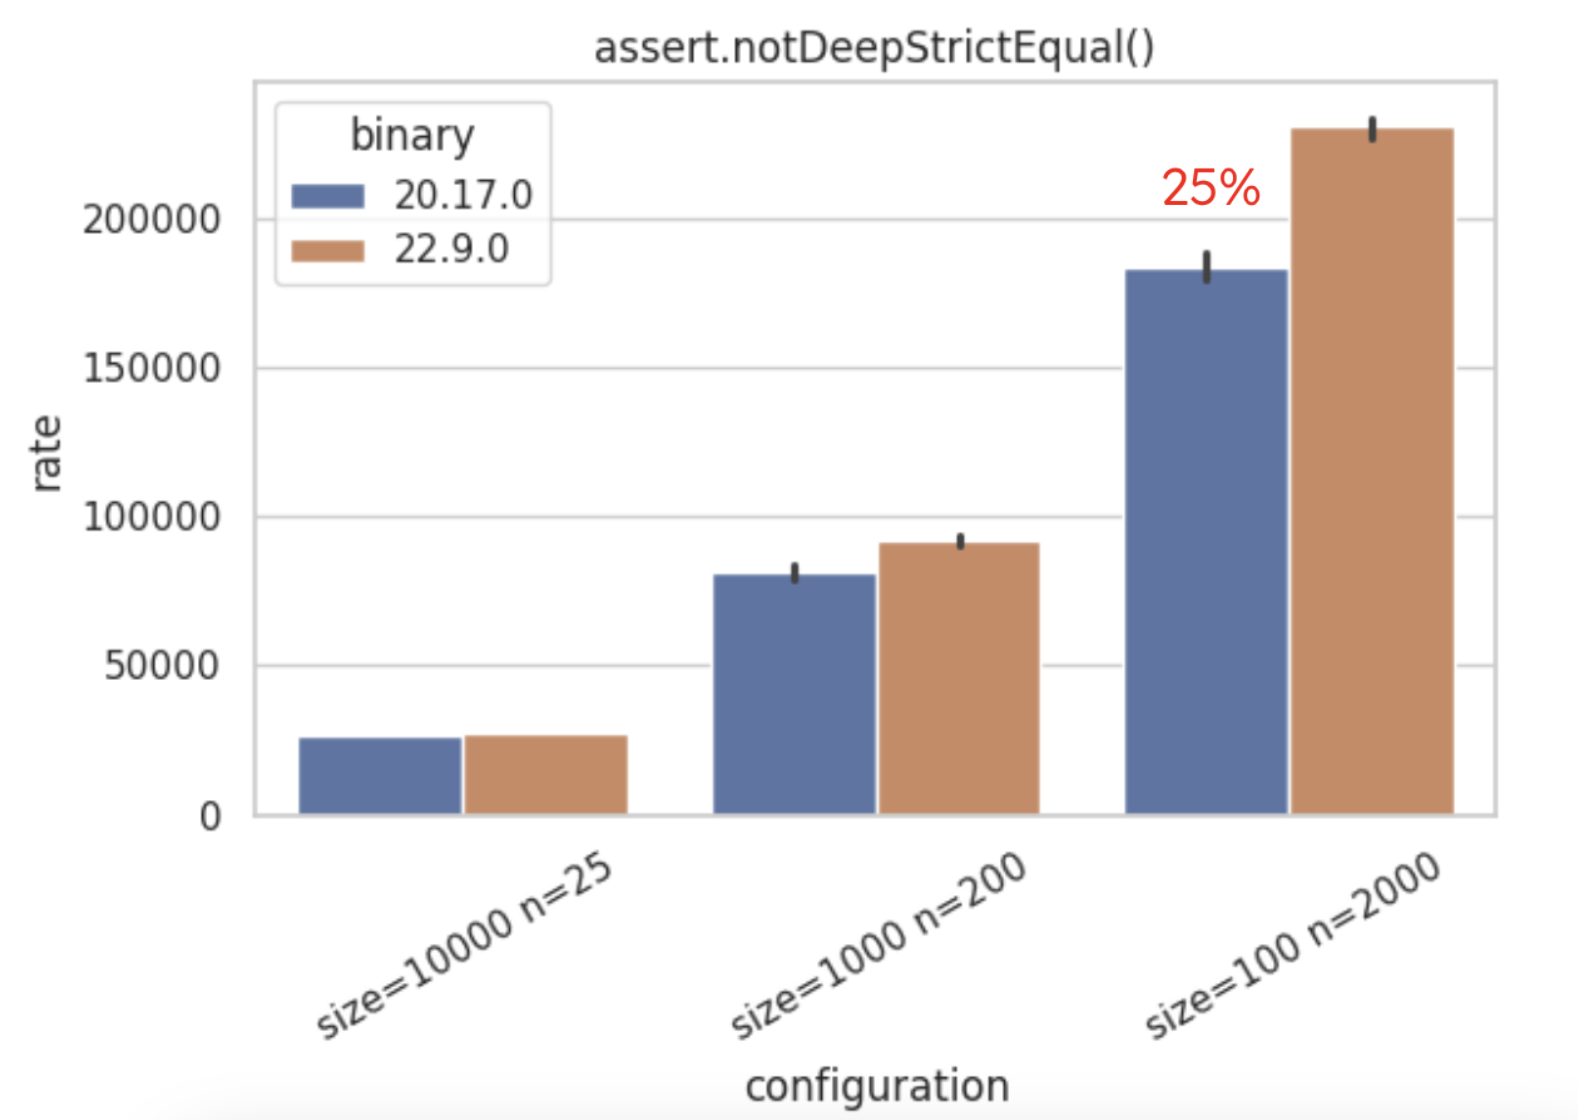
assert.notDeepStrictEqualis now 25% faster in Node.js v22 (on small-size objects).
-
assert.deepEqual(Buffers)– Improved by about 20%.

-
assert.strictEqual– Shows a 7% slowdown based on a reliable sample size (n=200K).

Buffers
Node.js Buffers have become significantly faster in all its APIs – except when handling base64 data.
-
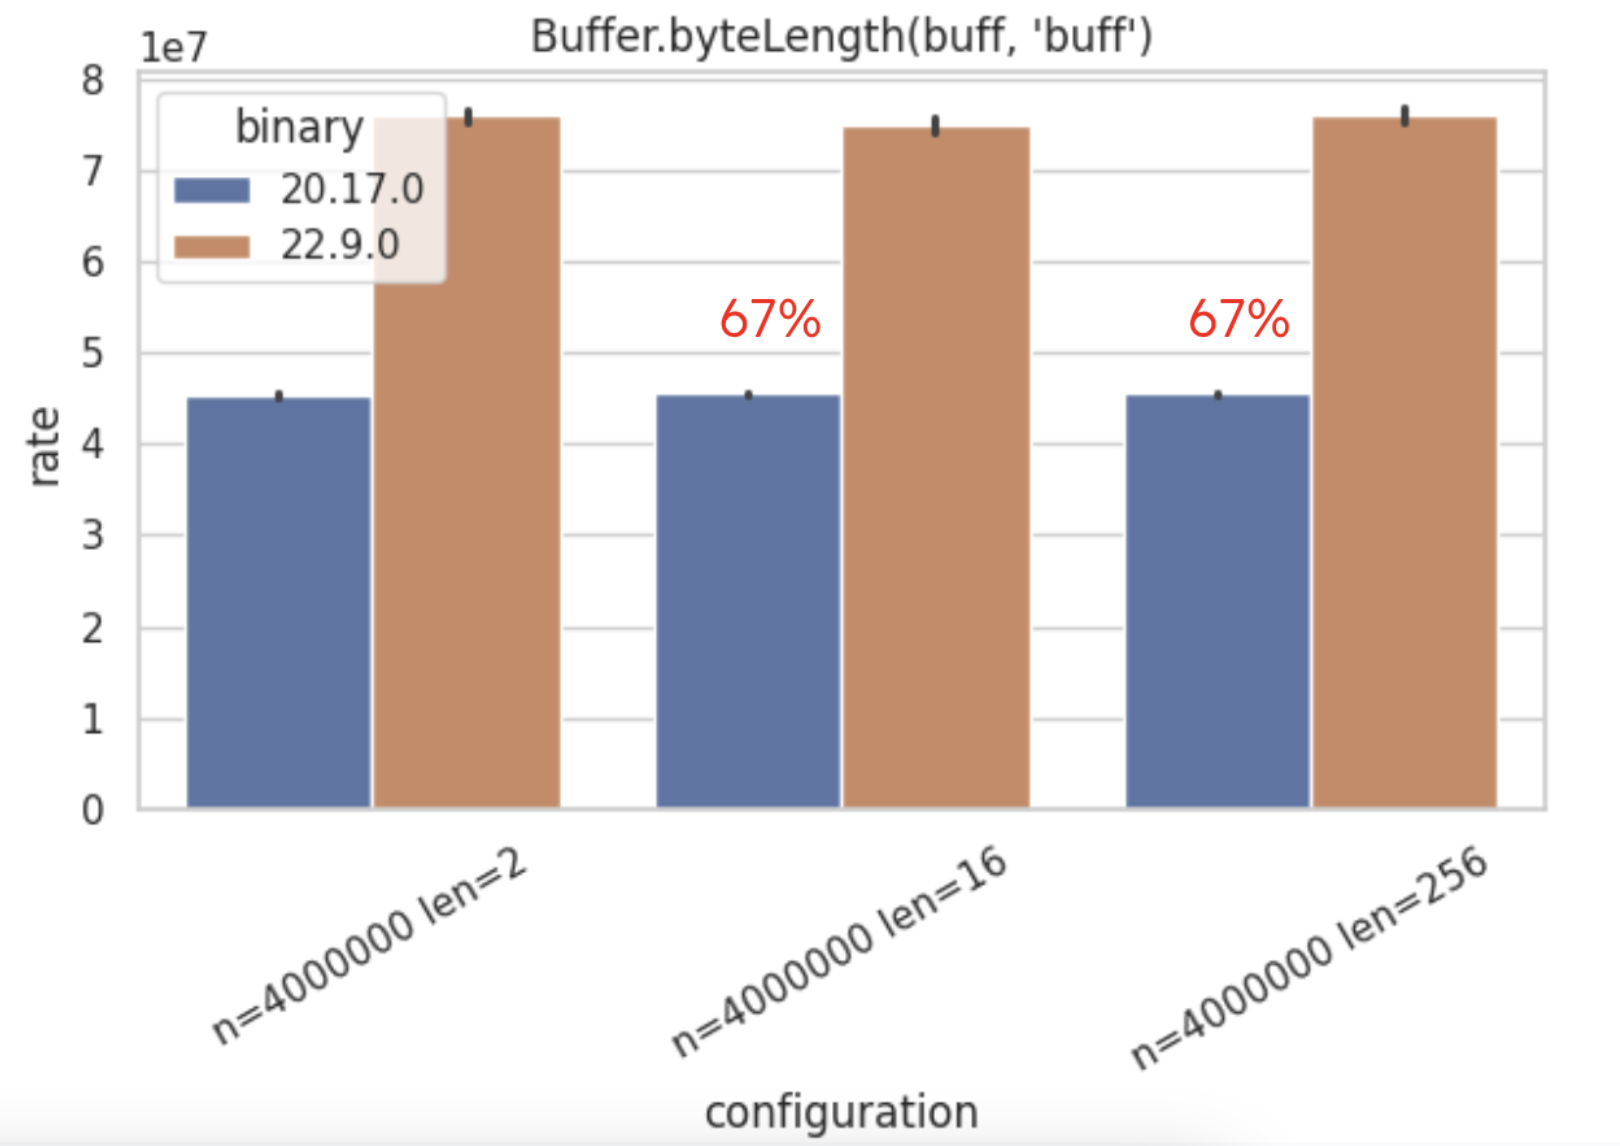
Buffer.byteLength– Shows a 67% of performance improvement when compared to v20.17.0.
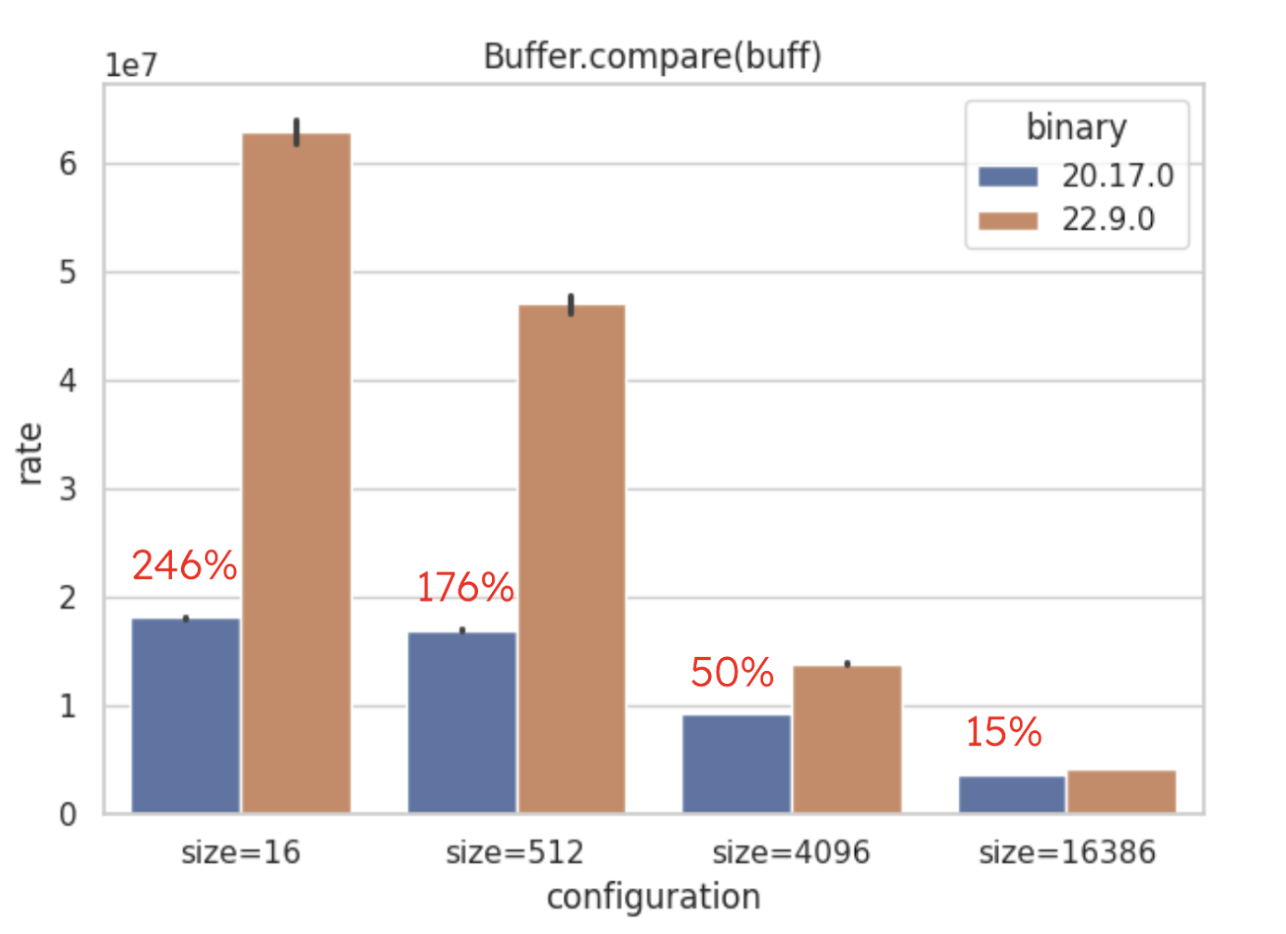
For buffer.compare(buff) specifically, performance has increased by over 200%,
marking a substantial improvement.
The following Buffer operations are all faster:
-
Buffer.concat()- 9% up to 33%! Combines multiple Buffers into a single Buffer efficiently. -
Buffer.copy()- When copying buffers using Buffer.copy(buff, 0, buffLen) 95% of improvement was identified. -
Buffer.equals()- Checks if two Buffers have identical byte content. Some results reach 150% improvement (see the image).

-
Buffer.read*(0, byteLength)- FromBuffer.readIntBE()toBuffer.readUIntLE()performance has been significantly boosted, and results cross the 100% barrier. -
Buffer.slice()- On .slice() a performance improvement of 90% has been identified on Node.js v22.9.0. -
Buffer.write(X, byteLength)- On .write() also received a significant boost, from 5% when dealing with BigInt64BE to 138% when dealing with FloatBE.
In general, the node:buffers module performs remarkably well, though Buffer.isUTF8 and Buffer.isASCII()
saw slight regressions.

Diagnostics Channel
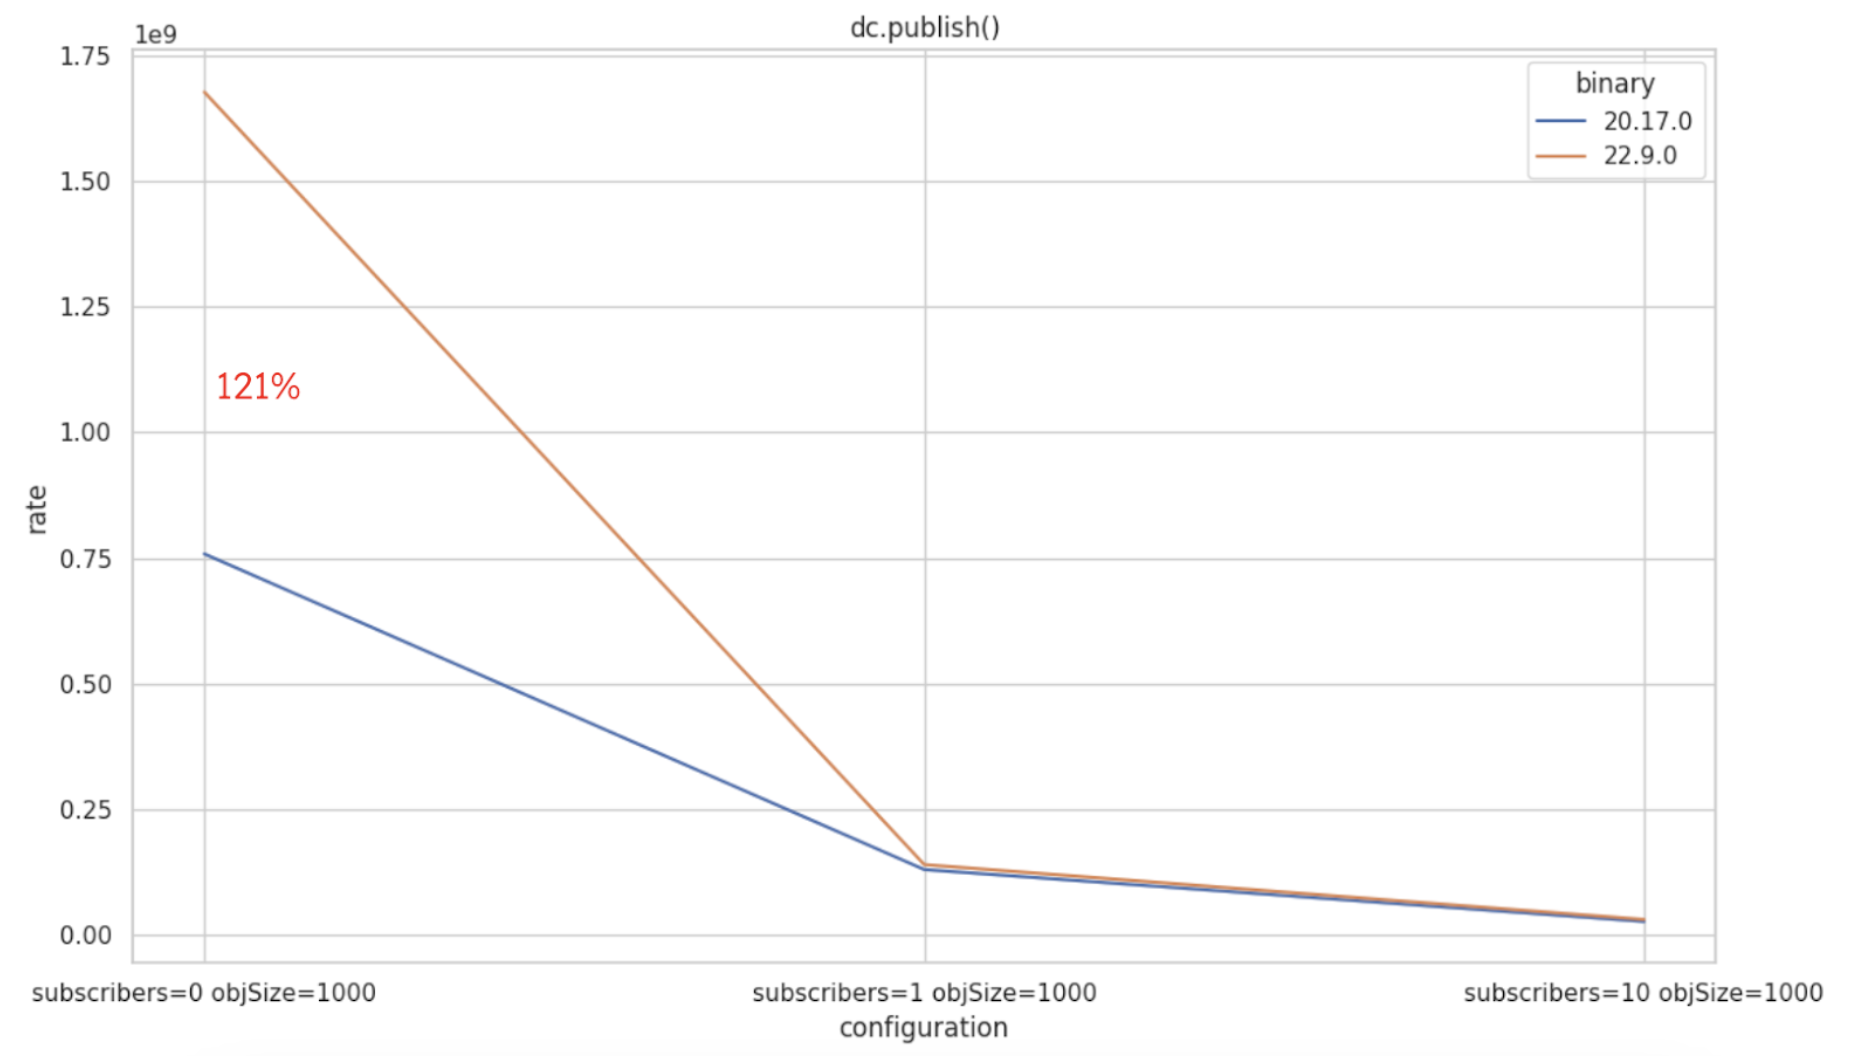
Diagnostics channels are now significantly faster when there are no subscribers—up to 120% faster, as shown in the graph below. This improvement is especially relevant for users who rely on diagnostic channels indirectly. At NodeSource, we leverage diagnostic channels in our APM, and this performance boost ensures that systems without subscribers remain unaffected.
Node.js File System
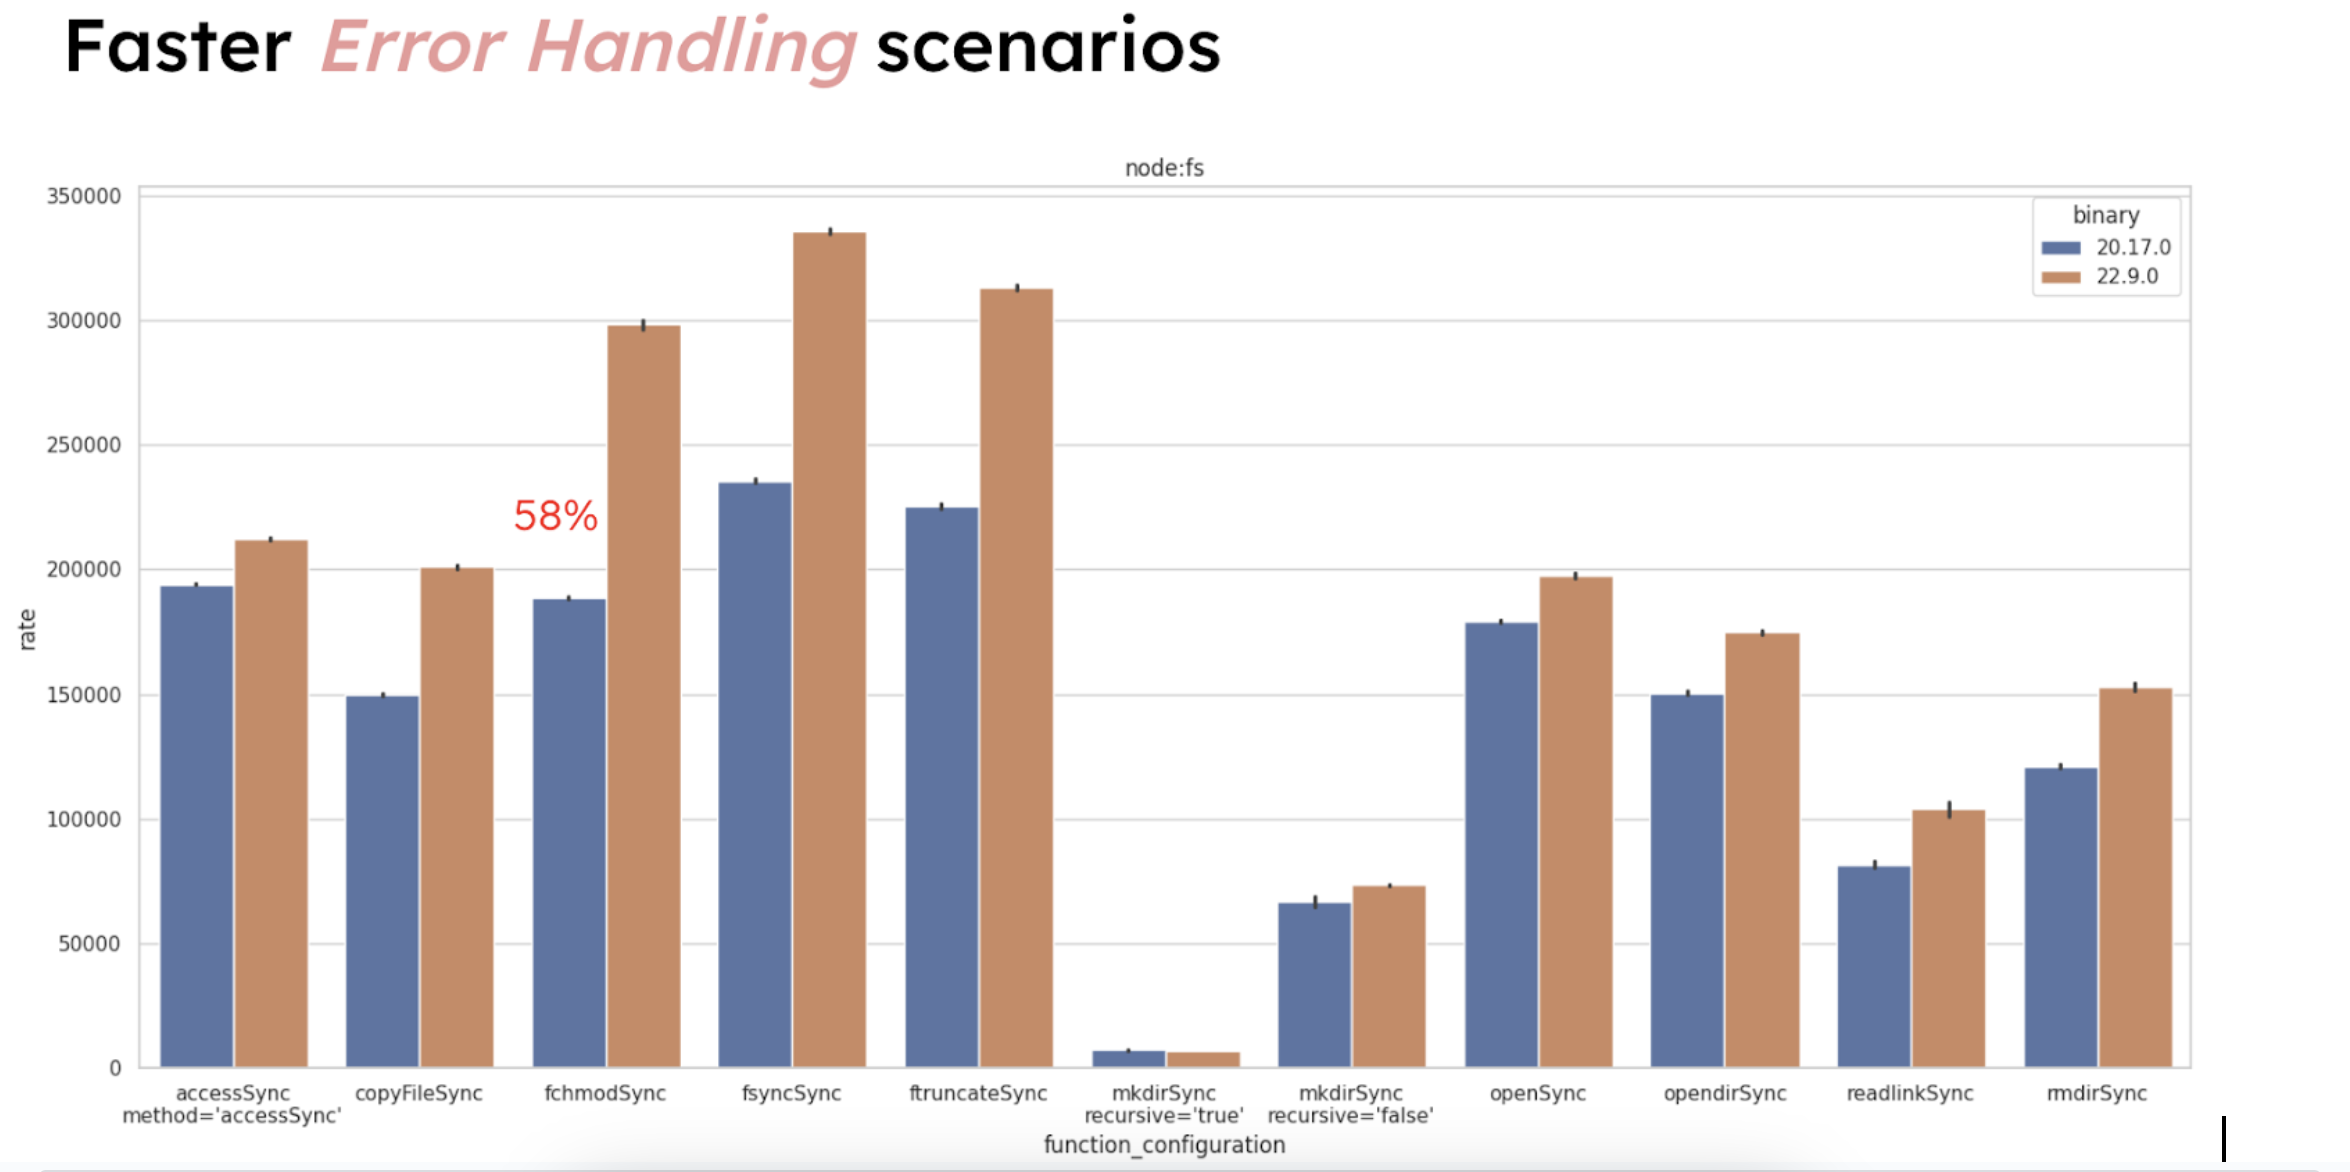
Node.js has improved its handling of error scenarios within the node:fs module. For instance,
attempts to open non-existent files fail ~58% faster. While this doesn’t change application
functionality, it speeds up error detection for processes that routinely check file availability
or integrity.
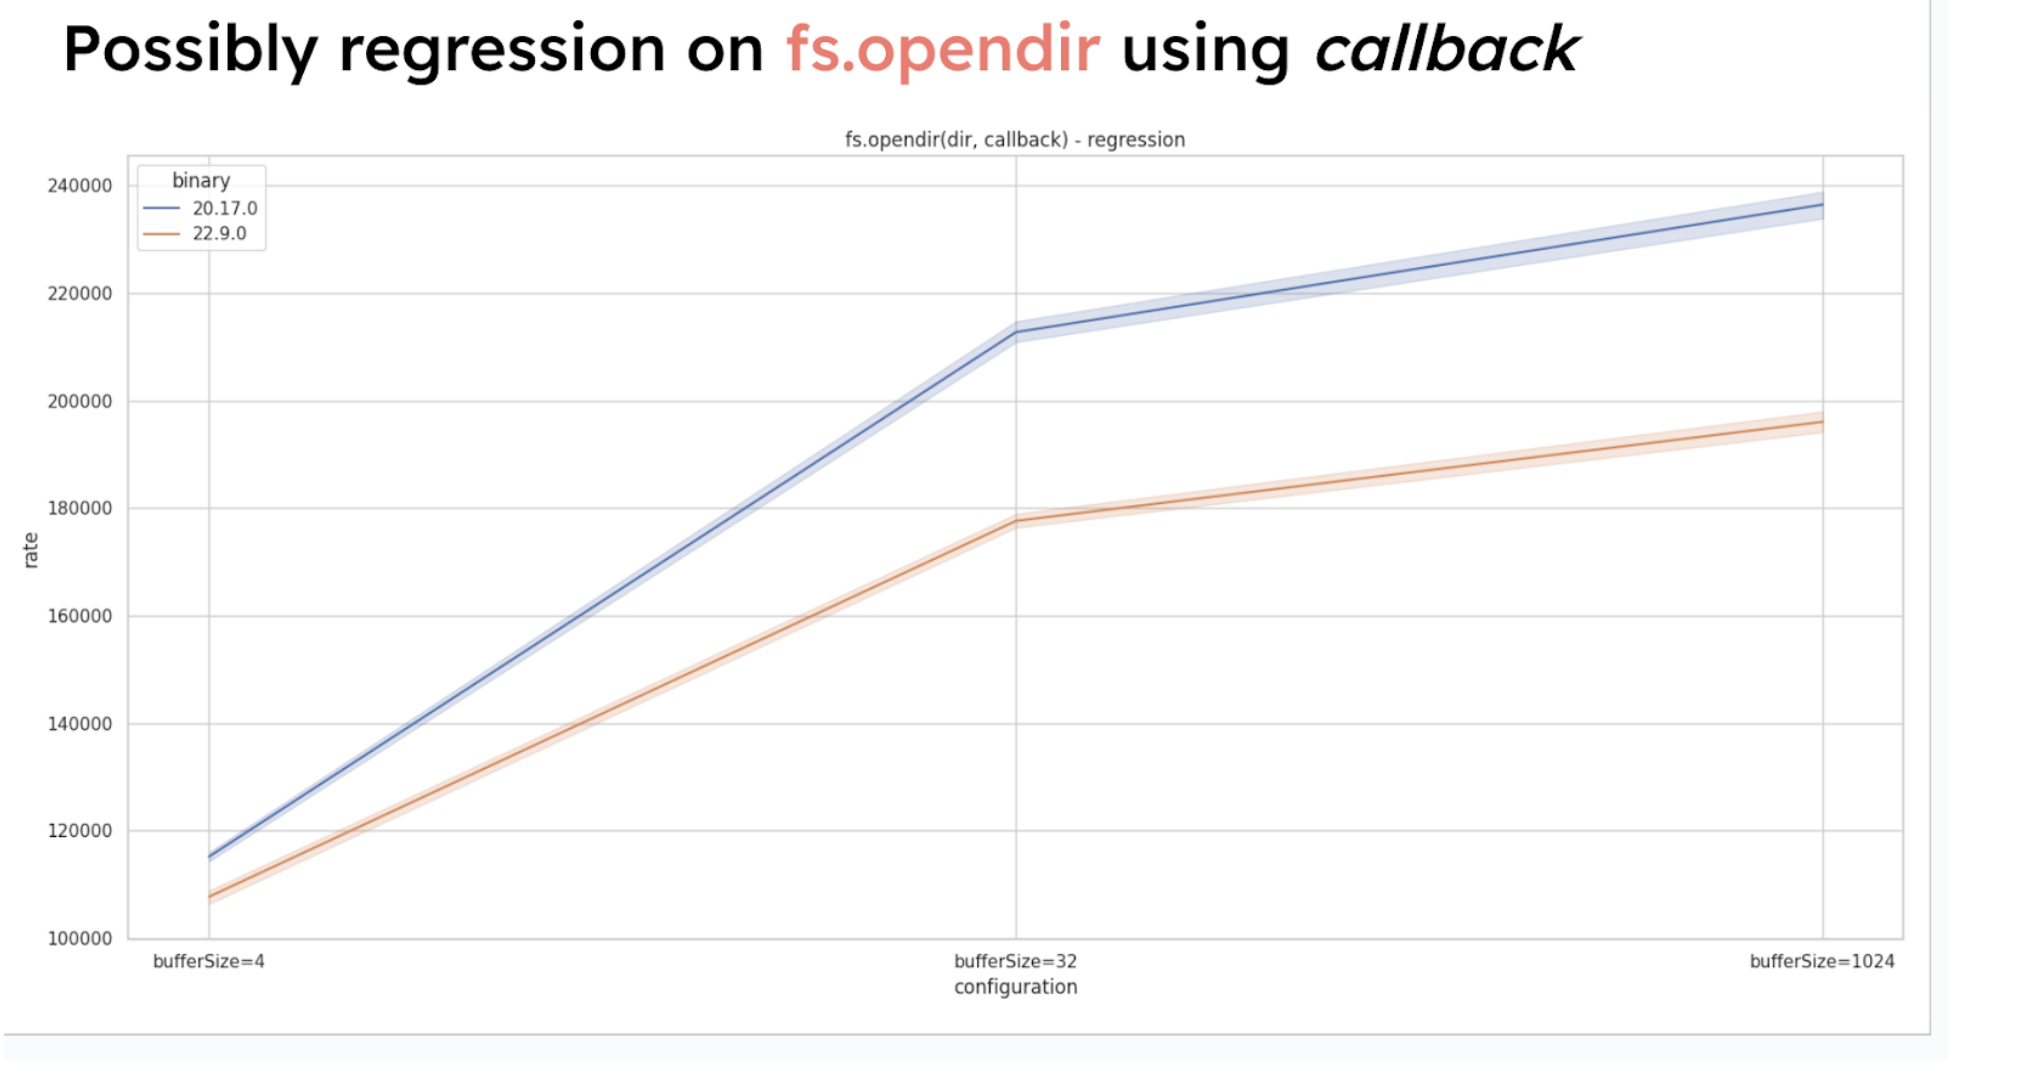
A potential regression was noted for fs.opendir when using callbacks, so this function may perform differently in certain callback-driven cases.
Faster node:path
Node.js’ node:path module has also seen performance gains. This benchmark only includes
POSIX environments (Linux and macOS). Improvements are:
path.basename() – Up to 10% faster.

path.isAbsolute() – About 38% faster.

path.resolve() – A minor ~9% boost in some cases.

Regressions in node:streams
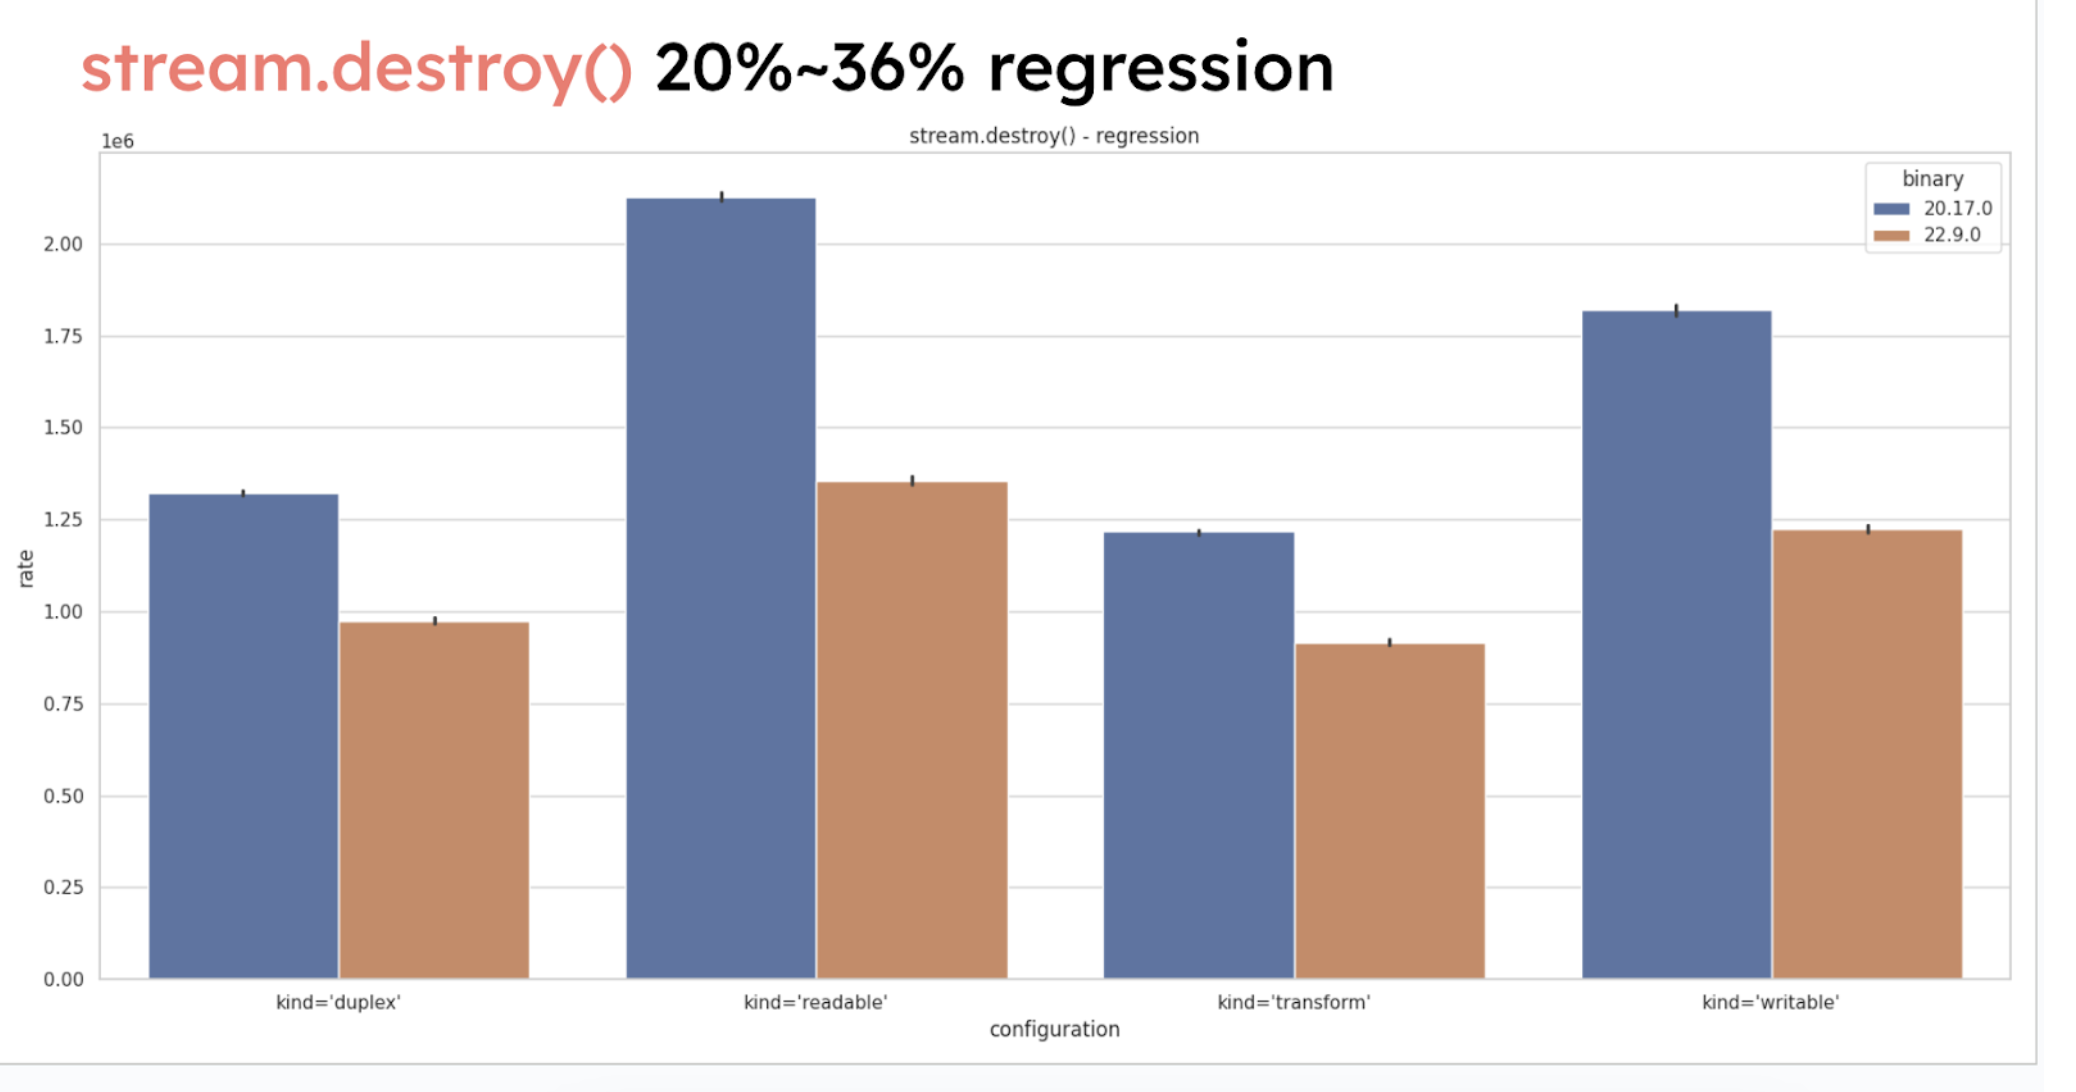
A notable regression has been detected in node:streams, specifically when destroying streams,
with a performance dip between -20% to -36%.
Node.js Test Runner
The Node.js benchmark test runner shows an approximate 10% performance boost in the test creation

and concurrent tests benefit from an additional 12% increase in speed

Node.js URL parser
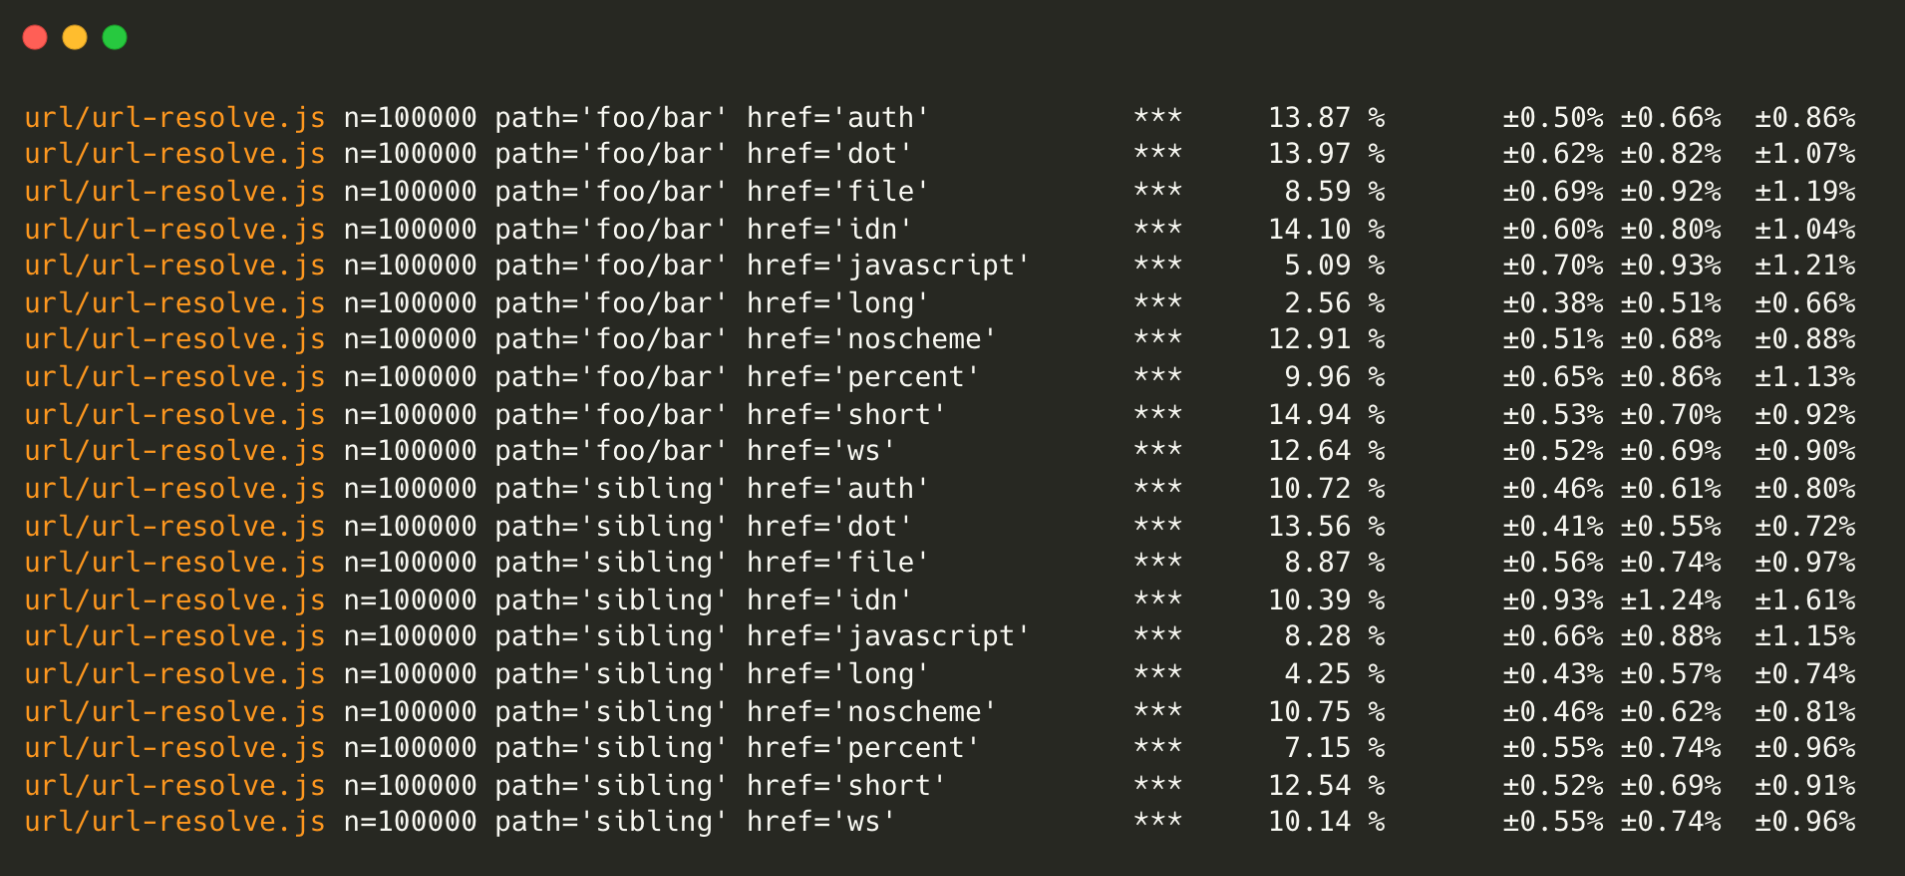
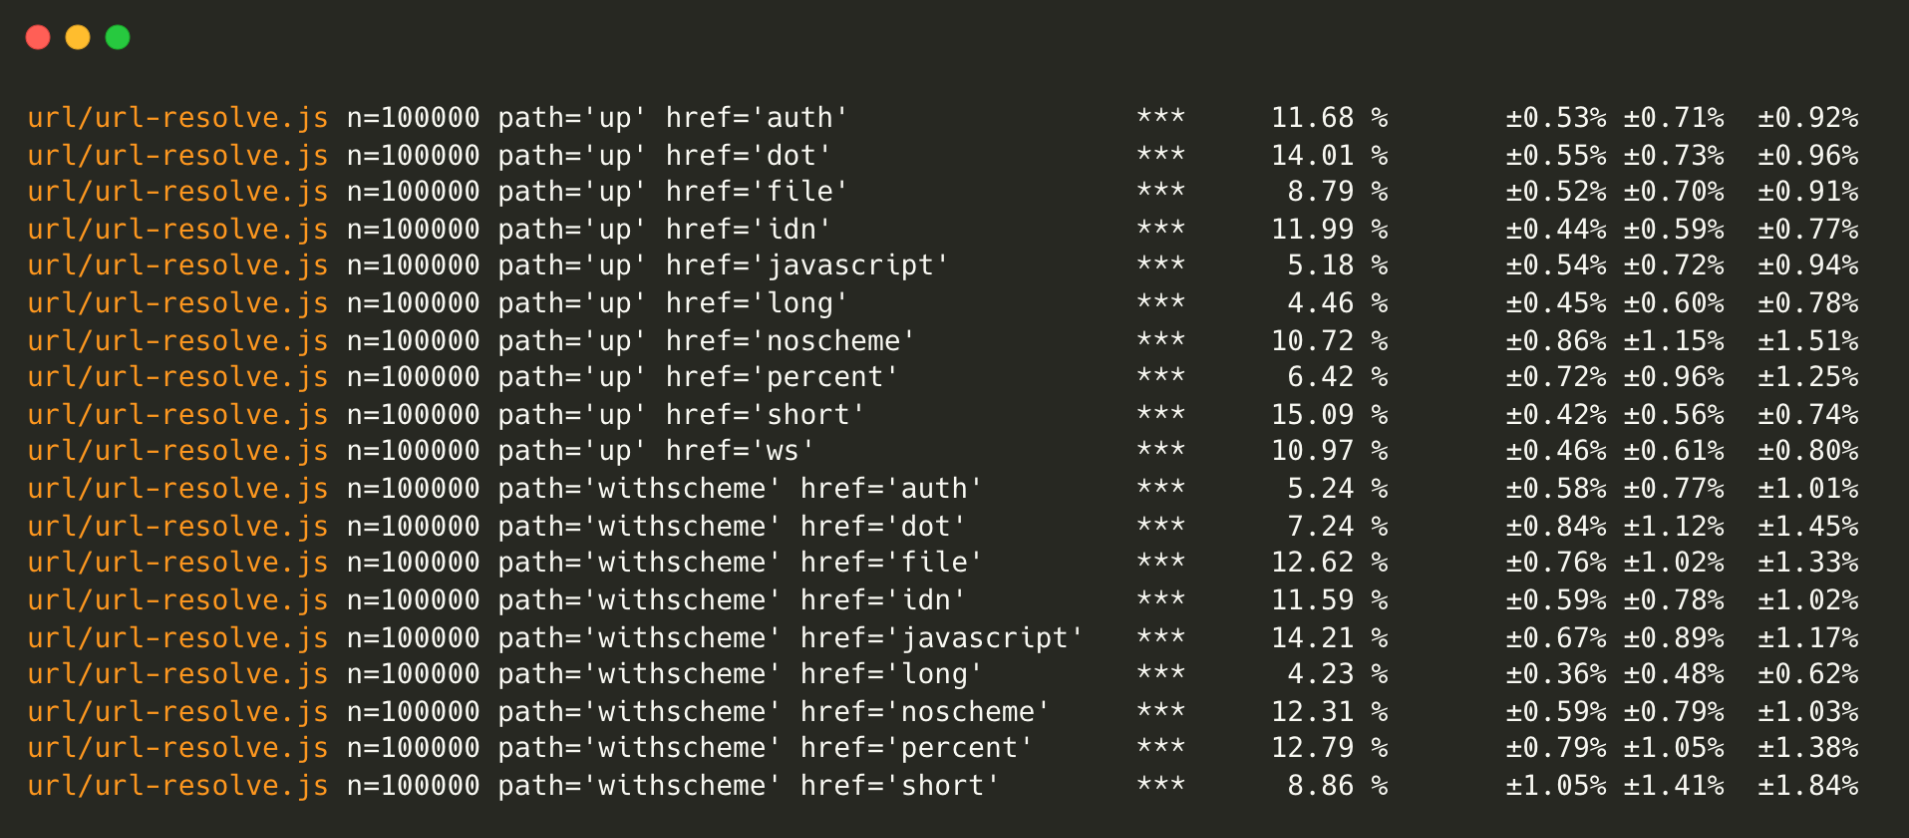
Node.js’ URL parser has become even faster. URL.resolve has been optimized, bringing significant performance improvements.
TextDecode Regression
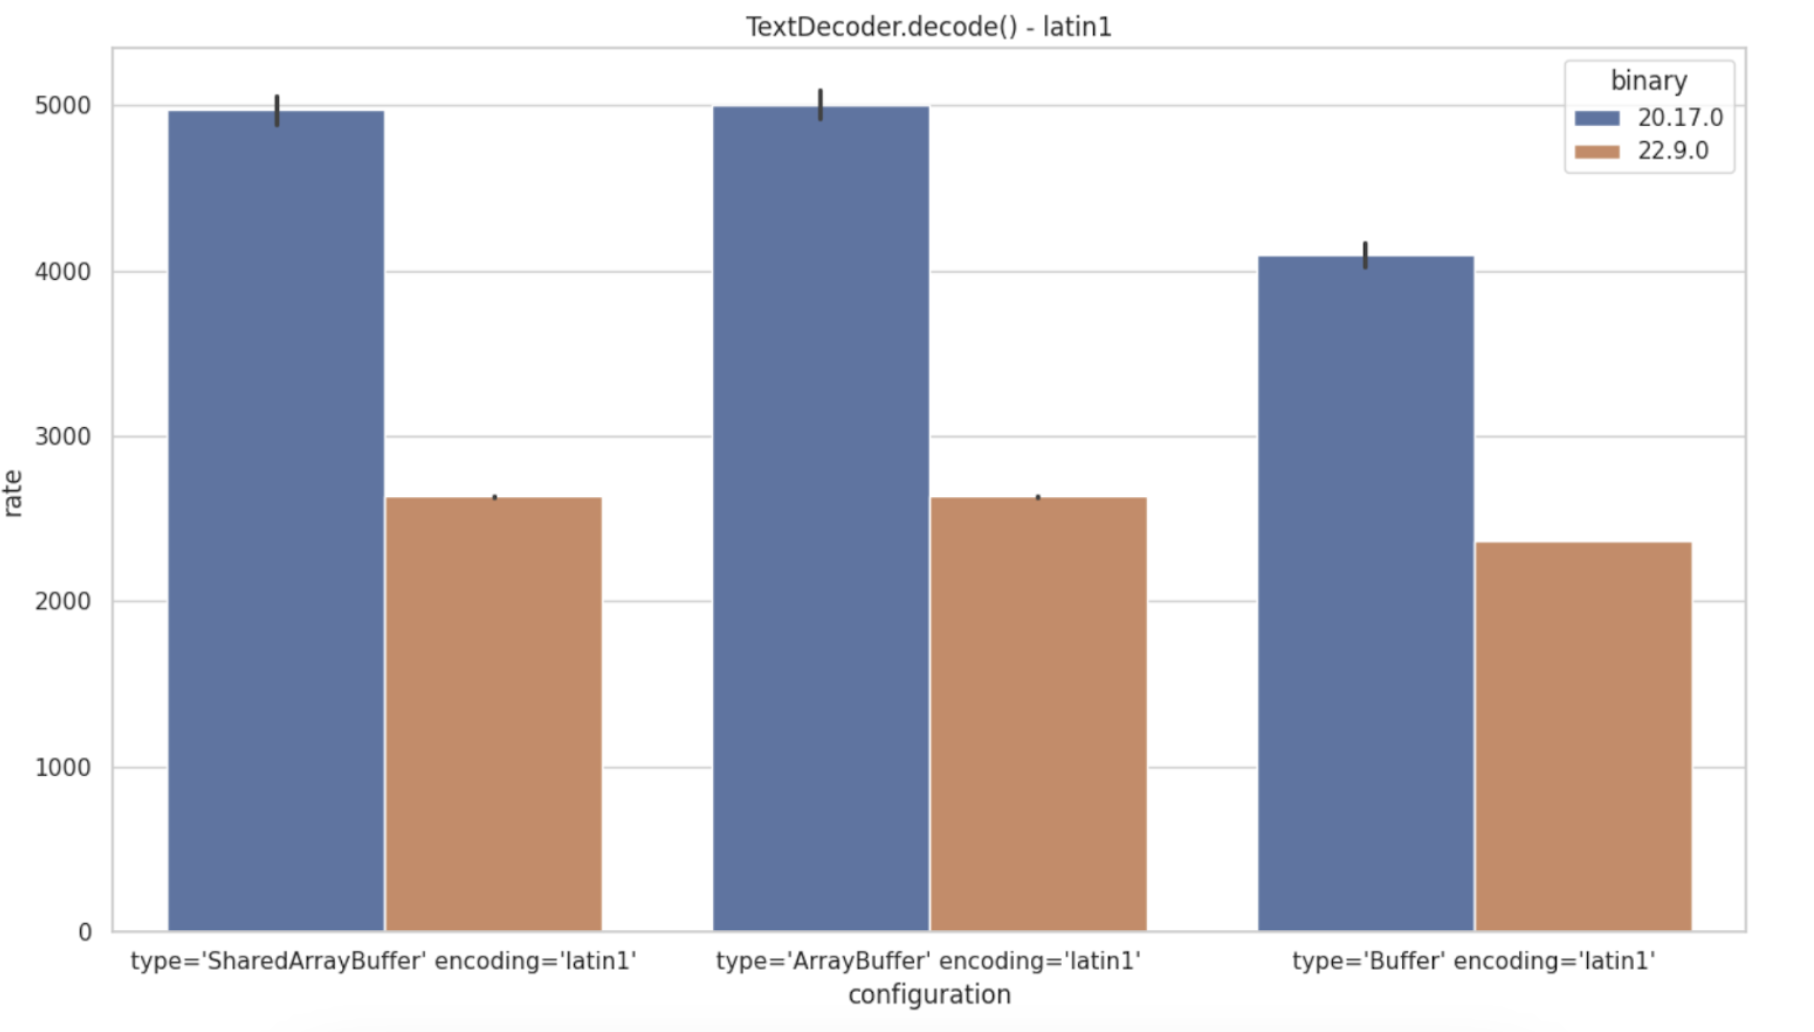
A major regression was noted in TextDecoder.decode(), specifically for Latin-1 encoding,
with a nearly 100% slowdown. ISO8859-3 is similarly affected.
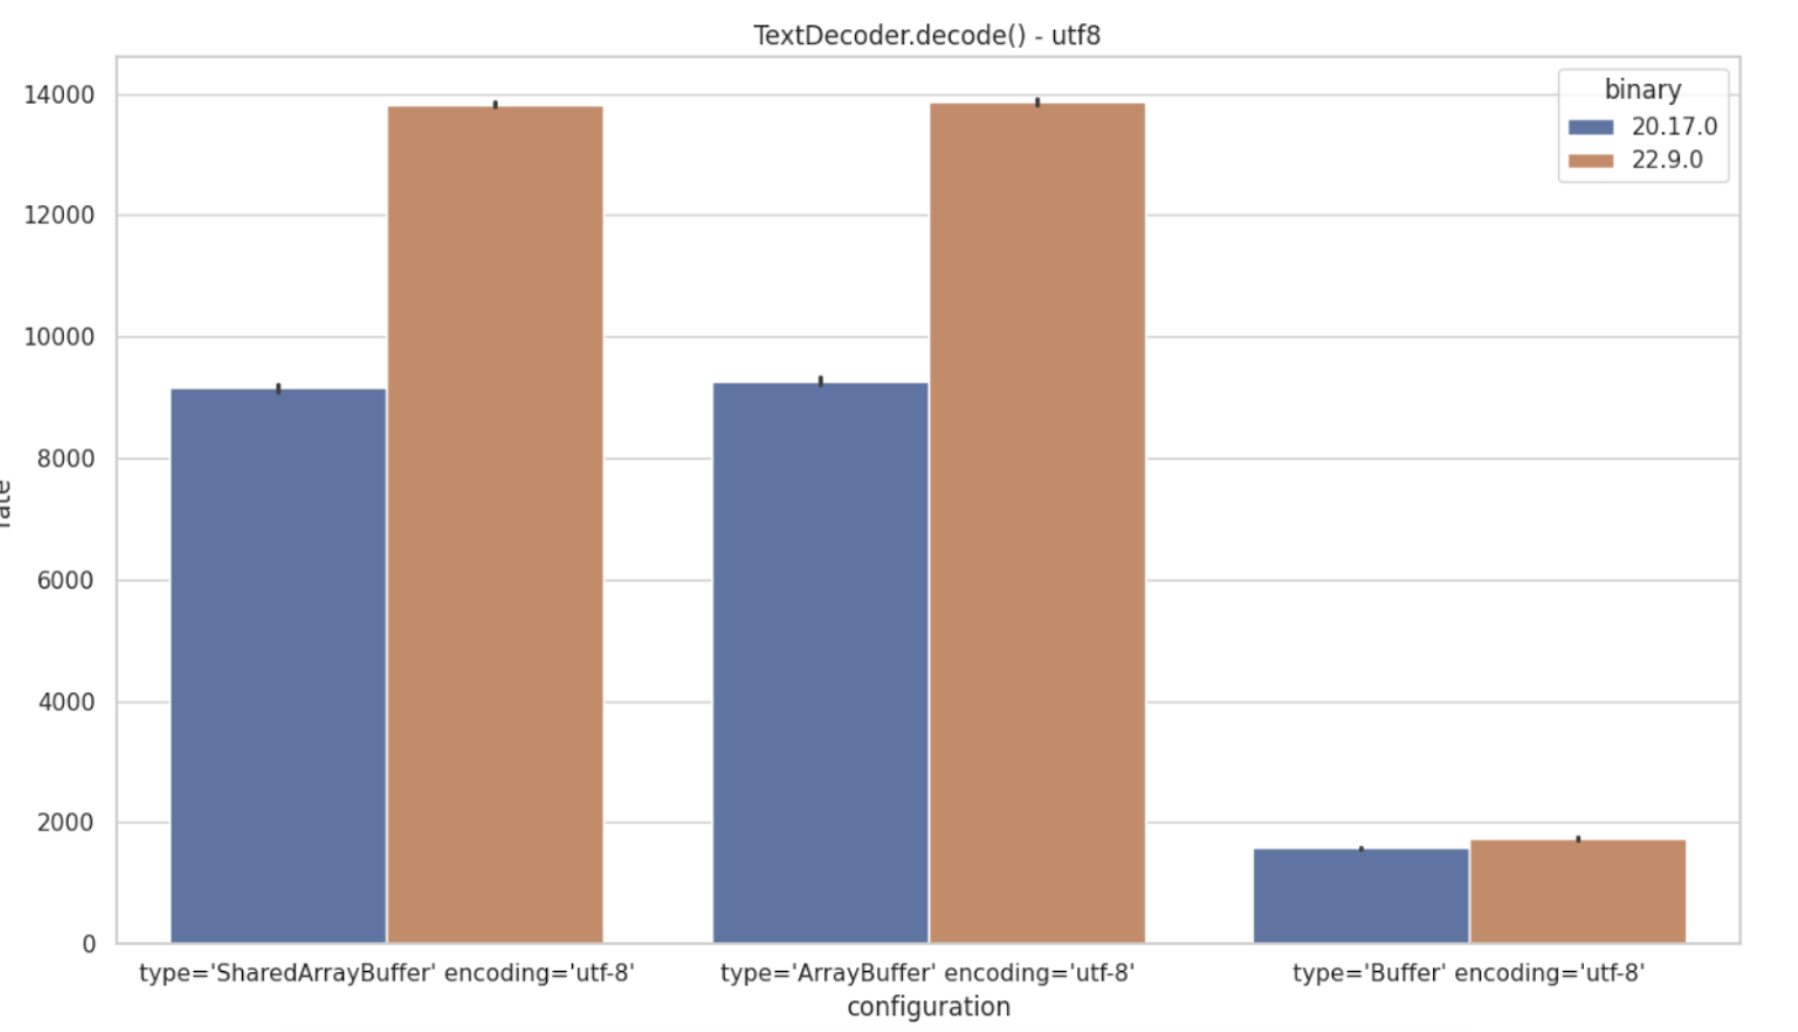
However, UTF-8 decoding shows a 50% speed increase, providing a marked improvement in certain use cases:
WebStreams
WebStreams performance has seen substantial gains, with improvements of over 100% across
various stream types, including Readable, Writable, Transform, and Duplex.
This is particularly impactful for fetch, a widely used HTTP request tool, as it relies
on WebStreams by specification.
Fetch and WebStreams
The fetch API is a web standard for making HTTP requests, and it requires the use of WebStreams
as part of its specification. Consequently, when WebStreams are optimized, fetch benefits directly,
which is why improvements to WebStreams are so impactful.
In 2022, there was an identified issue with the undici
library’s fetch implementation (used by Node.js), where fetch was notably slow compared to
alternatives. I have provided an analysis explaining that WebStreams’ inherent slowness was the main reason for fetch’s limited performance,
as fetch relies on WebStreams by design.
With the release of Node.js v22, improvements to WebStreams have helped Fetch jump from 2,246 requests per second to 2,689 requests per second, marking a good enhancement for an API known to be performance-sensitive.


Zlib Regression
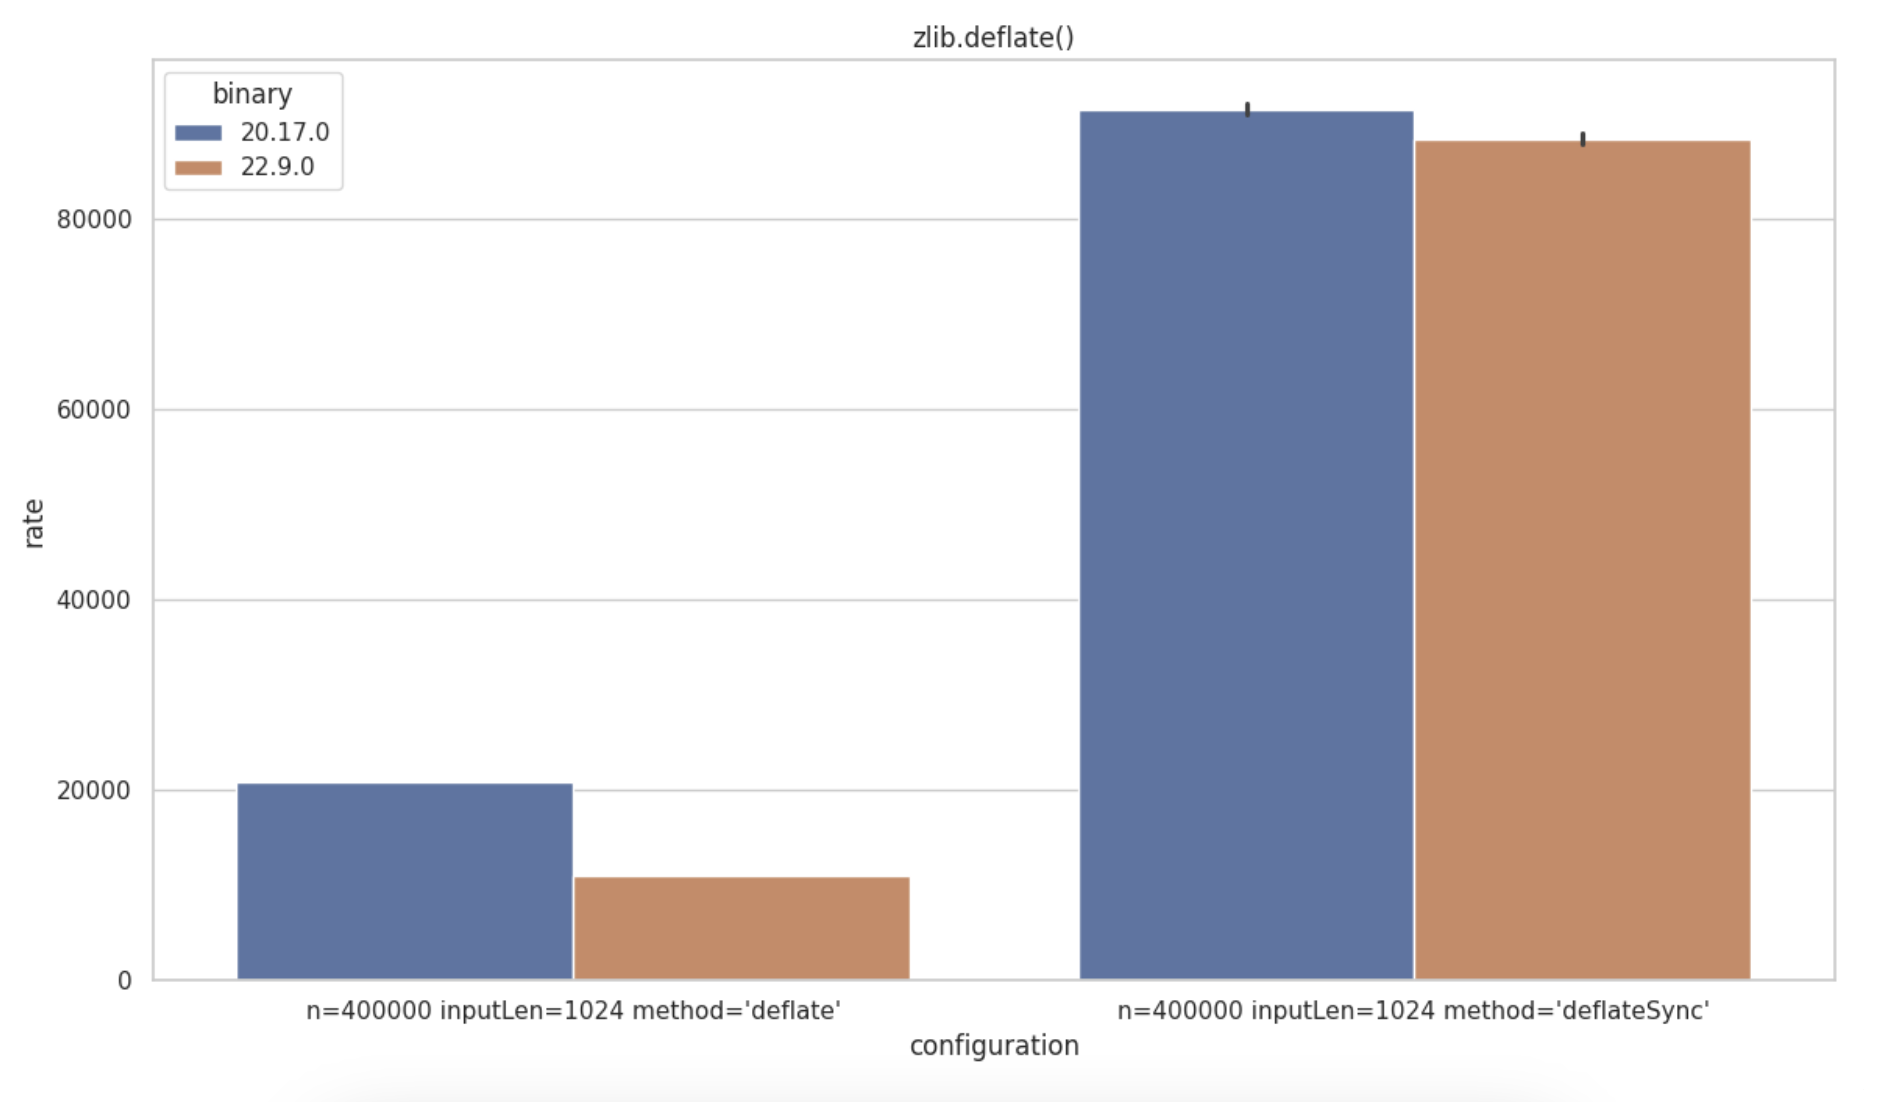
The zlib module in Node.js provides compression and decompression utilities using the Gzip and Deflate/Inflate algorithms. A regression has been identified on zlib.deflate() with a higher impact on the asynchronous API (zlib.deflate()) over the synchronous call (zlib.deflateSync())
Avoiding Dead-Code elimination on Micro-Benchmarks using bench-node
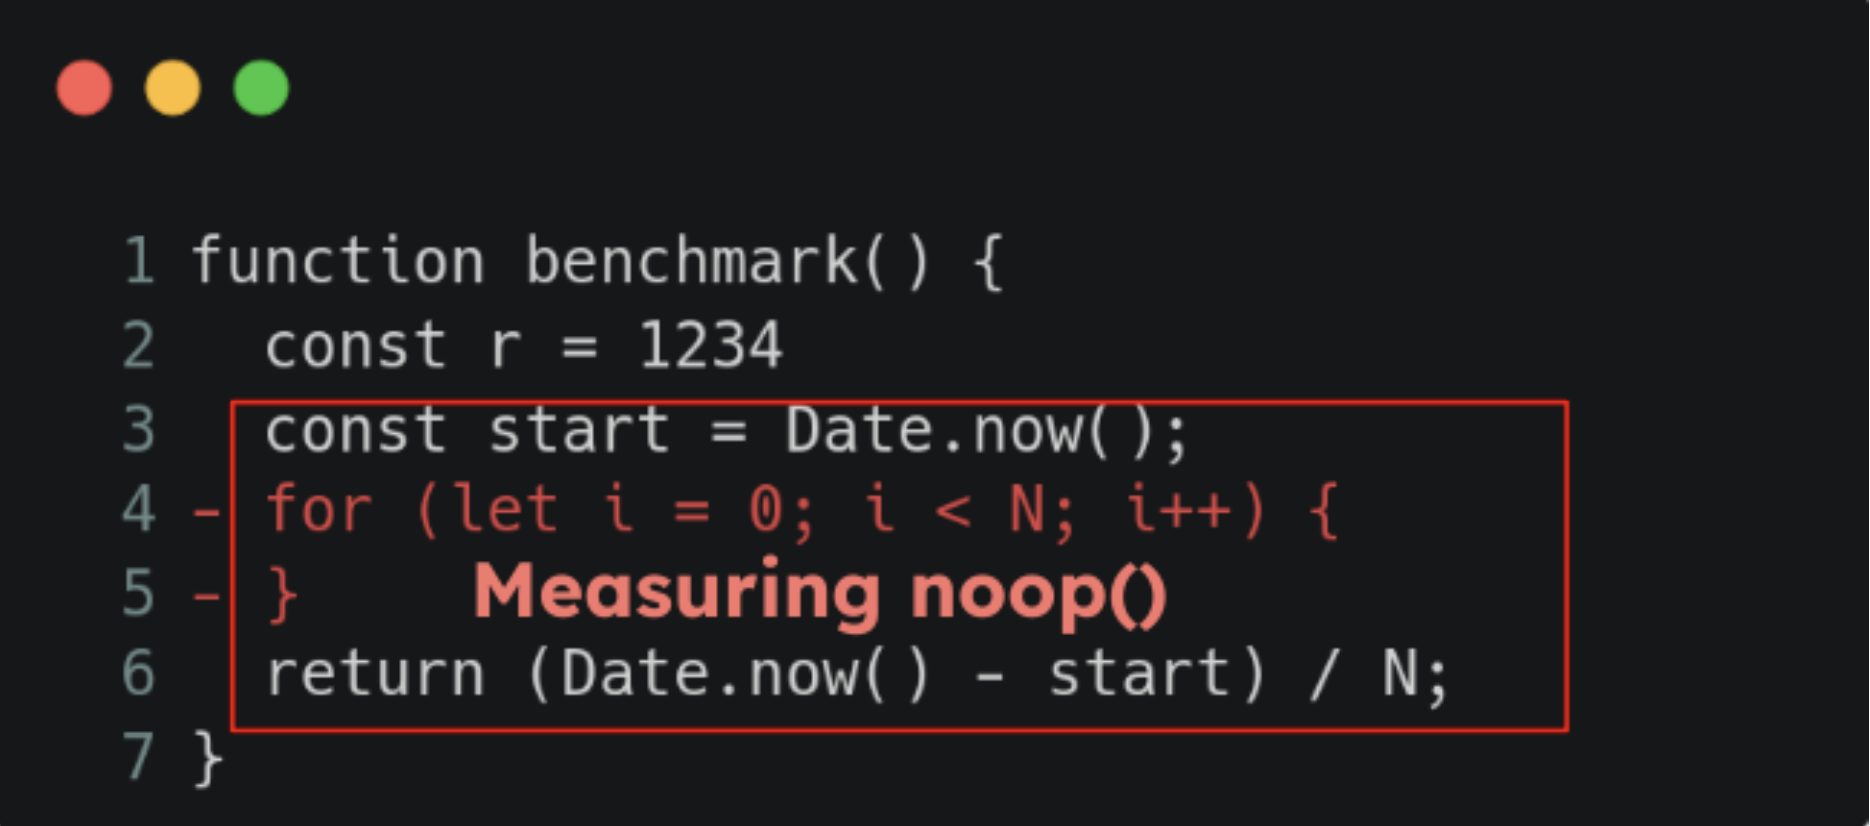
As said in “Handle JS Micro-Benchmarks carefully” it’s very common to see benchmarks being written in a way that after a full V8 optimization, the code will be removed as the V8 JIT compiler will flag the measured piece of code as prone to “Dead-code elimination”, so you will end-up measuring a noop().
That’s why bench-node has been created. This benchmark library by default tells V8 to never optimize your code
 beforeClockTemplate(_varNames) {
    let code = '';

    code += `
function DoNotOptimize(x) {}
// Prevent DoNotOptimize from optimizing or being inlined.
%NeverOptimizeFunction(DoNotOptimize);
`
    return [code, 'DoNotOptimize'];
  }
This article won’t dive into the internals of bench-node. Instead, the next section
will showcase benchmark results generated using this library. While bench-node excels
at providing a reliable and consistent way to compare simple operations, it’s important
to note that these results might not reflect real-world scenarios. In production,
V8 optimizations can significantly influence code performance, making it challenging to
perfectly replicate runtime behaviour.
nodejs-bench-operations
If you have read the “State of Node.js Performance 2023” you might know the nodejs-bench-operations repository. TL;DR It’s a repository to compare simple Node.js/JS operations across multiple versions of Node.js.
This repository also contains a regression checker, a GitHub action that compares results between different release lines and alerts in case of regressions/improvements greater than the 10% threshold.
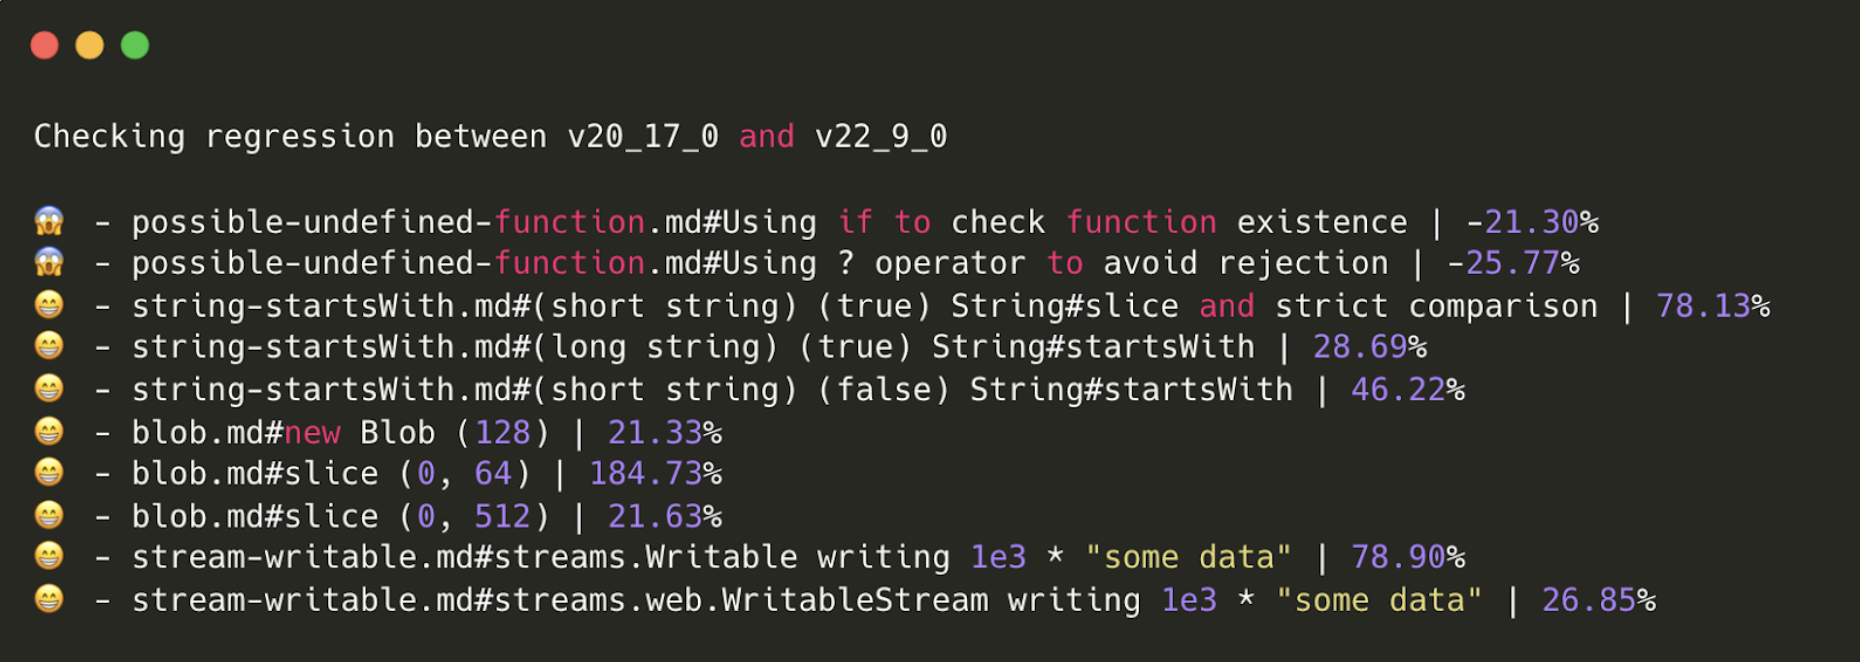
Significant improvements were identified in Blob.slice() handling > 2.5x more than the
previous benchmark result. The Writable benchmark seems to have improved both Streams
and WebStreams (it could be related to the Buffer improvements we have seen in the nodejs
internal benchmark suite). String.prototype.startsWith() noticed another important
performance improvement (due to the V8 update). The same applies to String.prototype.endsWith()

The nodejs-bench-operations also contains some curious benchmarks, for example, historically
parsing big integers integers using + was faster than using parseInt(x, 10).
Results from v18.x (https://github.com/RafaelGSS/nodejs-bench-operations/blob/main/RESULTS-v18.md#parsing-integer)
| name | ops/sec | samples |
|---|---|---|
| Using parseInt(x, 10) - small number (2 len) | 132,214,453 | 66107241 |
| Using parseInt(x, 10) - big number (10 len) | 17,222,411 | 8618478 |
| Using + - small number (2 len) | 104,781,265 | 52390642 |
| Using + - big number (10 len) | 106,028,083 | 53015910 |
However, this is not true anymore since Node.js 20 (https://github.com/RafaelGSS/nodejs-bench-operations/blob/main/RESULTS-v20.md#parsing-integer).
| name | ops/sec | samples |
|---|---|---|
| Using parseInt(x, 10) - small number (2 len) | 142,155,753 | 71077900 |
| Using parseInt(x, 10) - big number (10 len) | 89,211,357 | 44666124 |
| Using + - small number (2 len) | 99,812,366 | 49939813 |
| Using + - big number (10 len) | 98,944,329 | 49488636 |
Approaches that were utilized but not included in the article
Many other benchmark approaches were utilized while conducting this research:
-
tinybenchhas been used instead ofbench-nodeto certificate the accuracy of the nodejs-bench-operations results - HTTP Benchmarks using wrk2 and different HTTP Frameworks (express, fastify) were also conducted, but no expressive differentiation was identified that was worth it to mention in this blog post.
- NodeSource/nodejs-package-benchmark a Node.js benchmark for common web developer workloads was also utilized. No expressive results were found.
Why do regressions exist? Doesn’t the Node.js Team Measure Each PR for Regressions?
Achieving the benchmark results above required a dedicated machine to run the entire Node.js test suite, which took four days to complete. Imagine making a small code change to Node.js core, you might not immediately know if it introduces a regression until benchmarks are run. Running a full benchmark for every pull request, each taking days, would be highly resource-intensive and could significantly slow down development.
Given the scale of the Node.js project—with thousands of contributors and a vast codebase tracking every possible regression is challenging. The team strives to balance thorough testing with practical resource constraints, ensuring critical areas are well-covered while prioritizing rapid development.
That said, we actively monitor performance and are always open to sponsorship programs that could expand our benchmarking capabilities, helping to identify regressions earlier and further improve the quality of releases.
Acknowledgments
This article was only possible due to NodeSource’s support in sponsoring my work and providing the dedicated machines to run all benchmarks.